Stock Market Outlook
For The Week Of March 30th =
Downtrend
INDICATORS
-
ADX Directional Indicators: Downtrend
Institutional Activity (Price & Volume): Mixed
On Balance Volume Indicator: Neutral
ANALYSIS
The stock market outlook remains in a downtrend as we close out Q1.
The S&P500 ( $SPX ) fell 1.5% last week. The index is ~5% below the 50-day moving average and ~3% below the 200-day moving average.
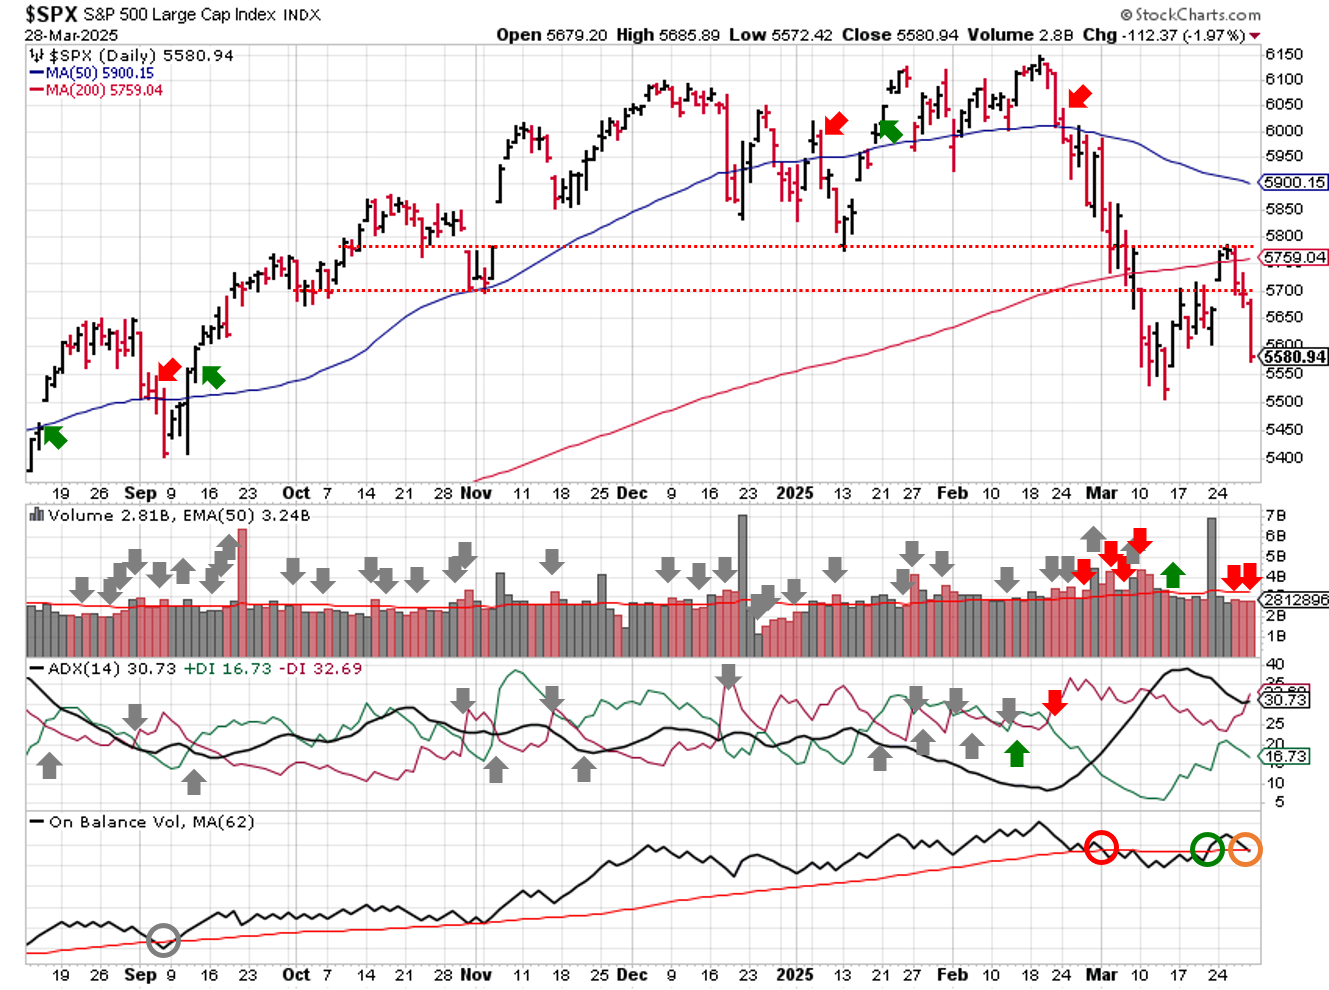
SPX Technical Analysis - March 30 2025
The Average Directional Index ( ADX ) remains bearish. On-Balance Volume ( OBV ) moved back to it's trendline, so the signal shifts back to neutral.
Institutional investors wouldn't or couldn't provide a follow-through day for the currently rally attempt; the 3/24 move didn't have enough trading volume and prices immediately retreated from resistance. It's still possible we get a follow-through day this week, but distribution days between the start of a rally and the follow-through are never a good sign and we had 2 last week.
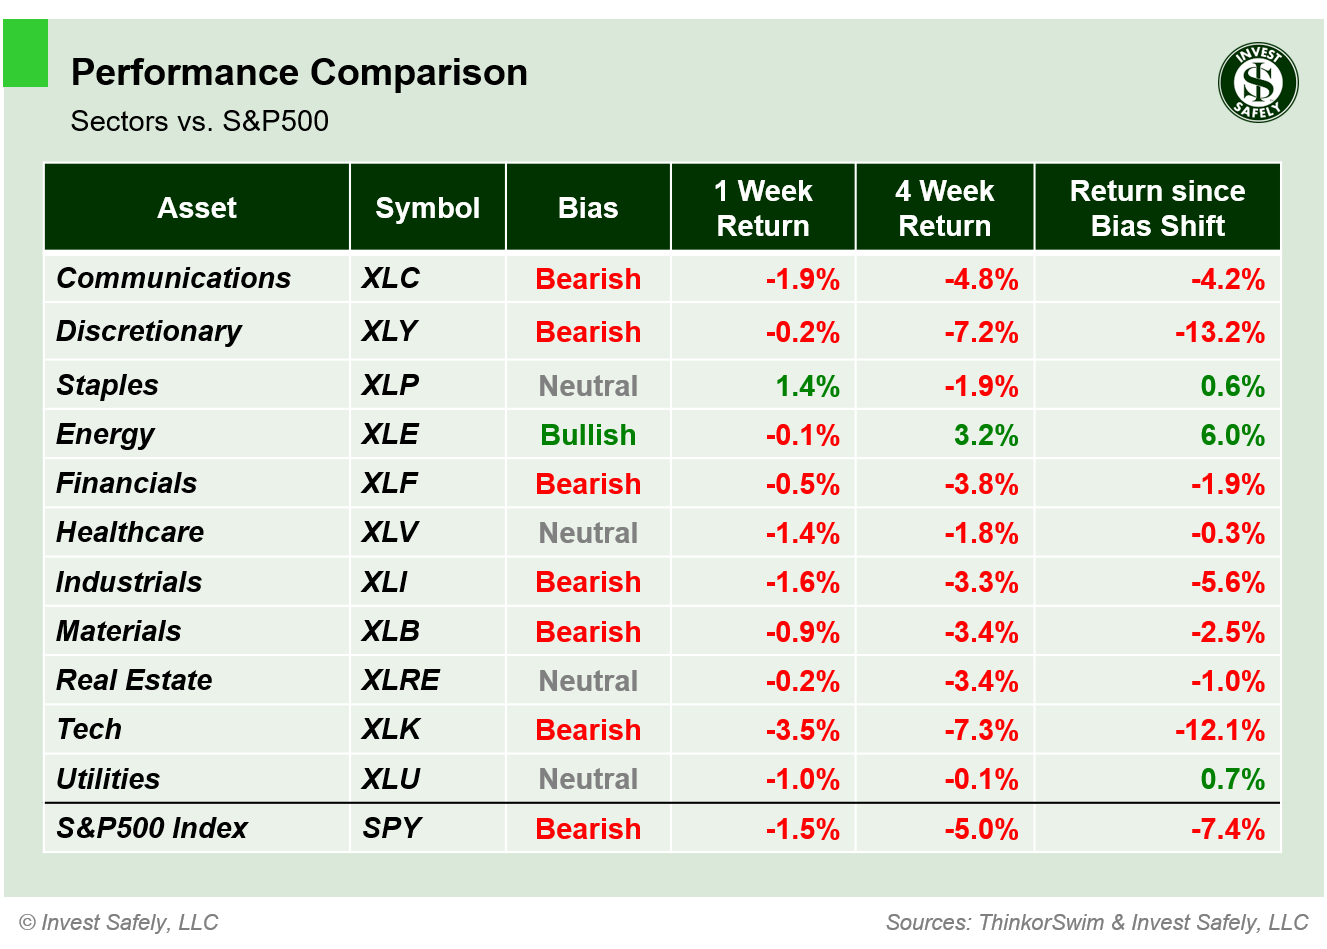
Consumer Staples ( $XLP ) was the only sector to secure a gain last week, while Technology ( $XLK ) led to the downside. Consumer Staples, Health Care, and Utilities ( $XLP, $XLV, $XLU ) moved to Neutral bias.
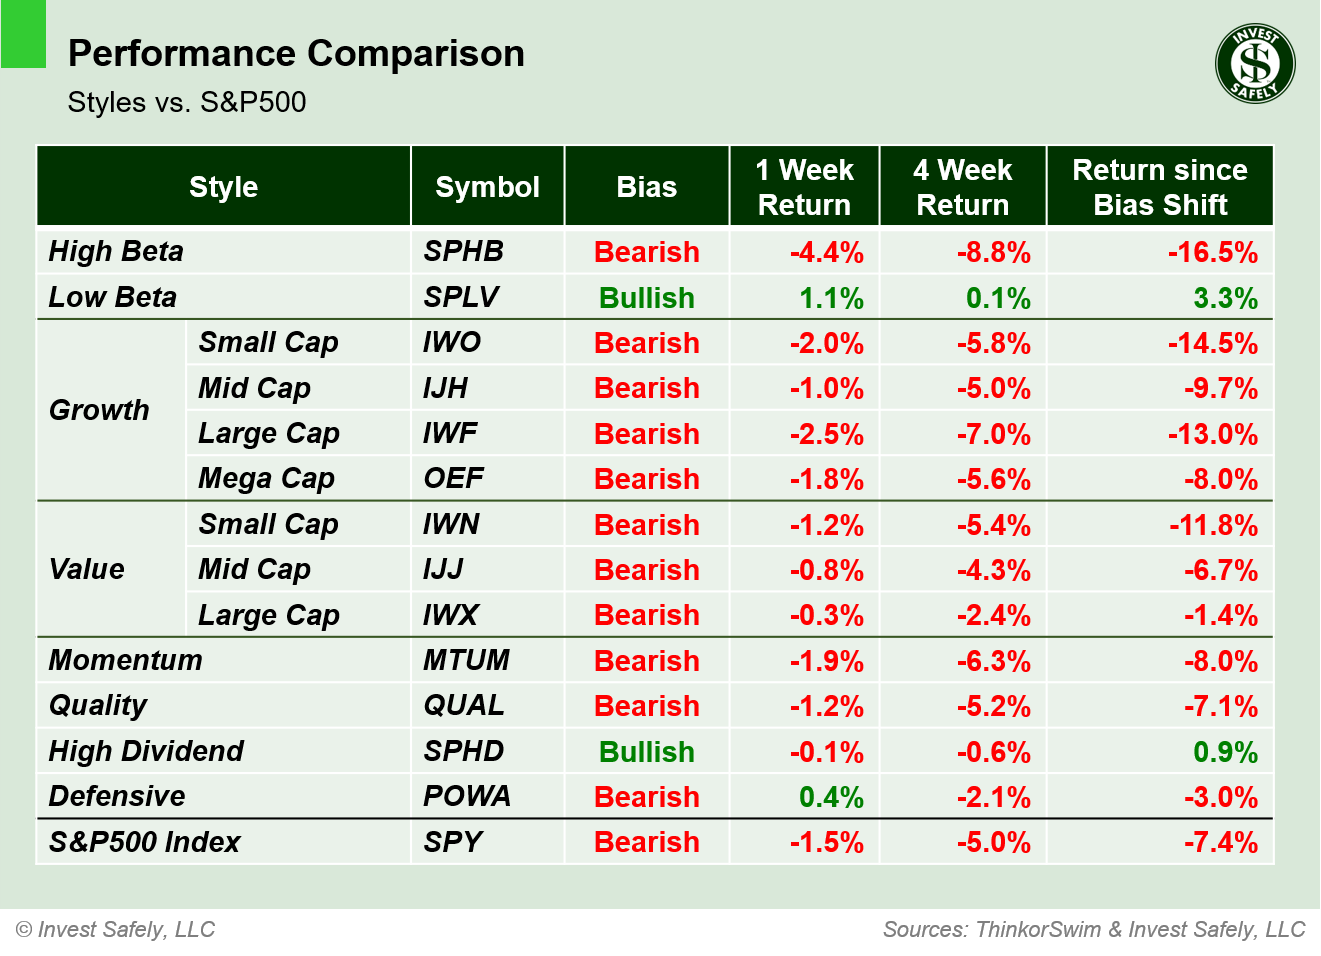
Low beta ( $SPLV ) provided some shelter from last week's selling, while High Beta sold off hard ( $SPHB ). Not changes in bias and still a bearish picture overall.
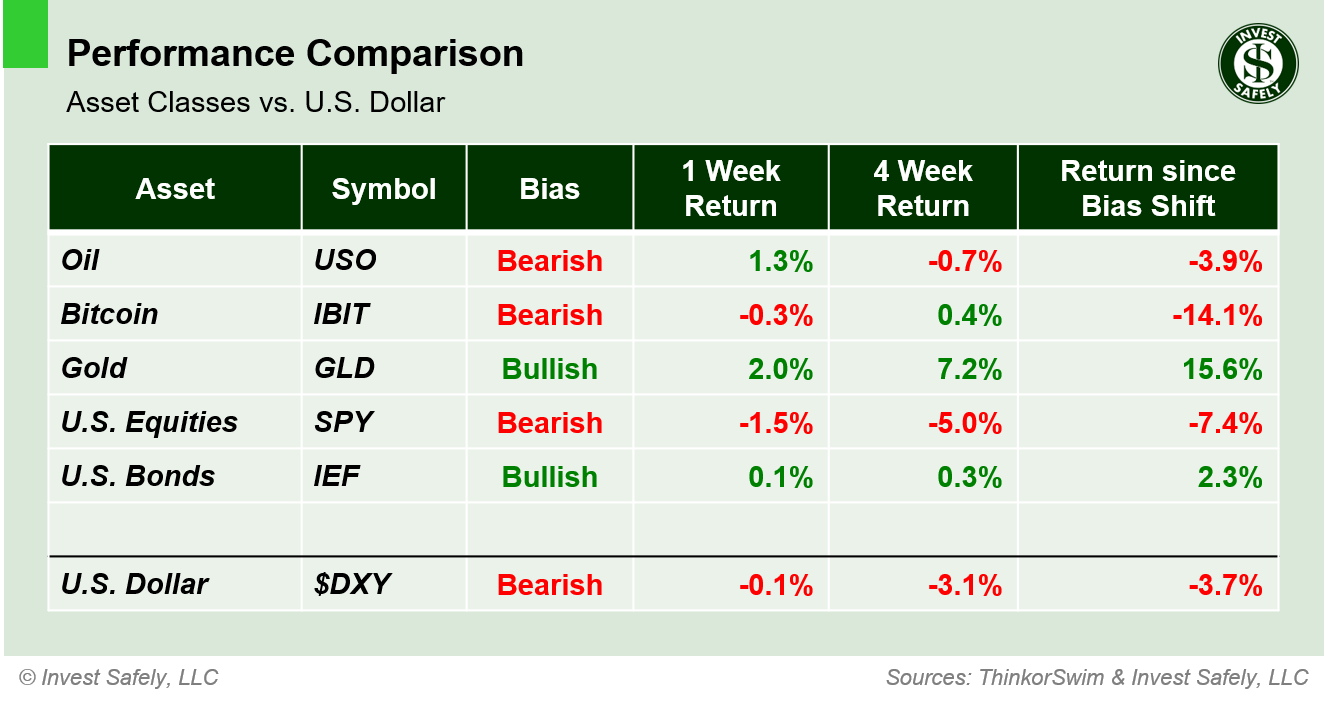
Gold ( $GLD ) was the best performing asset last week, while U.S. equities ( $SPY ) were the worst. No change in bias; defensive assets remain the strongest.
COMMENTARY
Leading off with a a bit of housekeeping: corrected an issue with the performance tables, specifically the "Returns since Bias Shift" for the Bearish designation. A minor issue, but after review, one that provides a great reminder to avoid deploying capital into bearish sectors, styles, and asset classes!
The latest rally attempt did, in fact, reveal itself to be a counter-trend bounce:
Until we see more shifts to bullish bias by sectors and styles, as well as breakouts by individual growth stocks, consider the recent move as a counter-trend bounce.
2024 Q4 GDP got a slight increase for the final estimate, coming in at +2.4%. Unfortunately, that means slowing growth, since it's 0.8% lower than Q4 2023. Q1 2025 GDP is likely to "disappoint" again, coming in around 1% (for reference, 2024 Q1 was 1.6%).
February PCE showed no movement in the headline data. Core came in at 2.8%, higher than January's 2.7%*, which was also adjusted higher from 2.6%. So inflation remains "sticky", and that's prior to any potential impact from new tariffs.
| PCE (y/y) | Actual | Prior | Expected |
| Headline | +2.5% | +2.5% | +2.5% |
| Core | +2.8% | +2.7%* | +2.6% |
This week, we get job and survey data, in the form of ISM PMI results, JOLTS, and Non-Farm Payrolls. From a volatility perspective, the big event this week comes on Wednesday (April 2), when the current administration is expected to announce an updated trade policy, centered on reciprocal tariffs.
There's been a lot of mixed messaging leading up to the event, and you know how market participants react to uncertainty...they hedge and /or sell. And remember those 25% tariffs on Mexican and Canadian imports? April 2 is the expiration date for those as well.
With slowing economic growth, sticky inflation, and the threat of tariffs exacerbating both, don't be surprised when you hear talk of "stagflation", or even the "R" word (i.e. recession), hitting the airwaves in April. But by that time, it'll be old news, since U.S. equities showed their hand back in February.
Instead, use your time to manage your portfolio, making sure you've got minimal exposure to bearish trends, while maximizing allocations to assets, sectors, and styles that are moving to and sustaining a bullish bias. Currently, that's investments in precious metals, European equities, or U.S. bonds.
Best to Your Week!
P.S. If you find this research helpful, please tell a friend.
If you don't, tell an enemy.
Sources: Bloomberg, CNBC, Federal Reserve Bank of St. Louis, Hedgeye, U.S. Bureau of Economic Analysis, U.S. Bureau of Labor Statistics
Share this Post on:

How to Make Money in Stocks: A Winning System in Good Times and Bad.
It's one of my favorites.
I regularly share articles and other news of interest on:
Twitter (@investsafely)
Facebook (@InvestSafely)
LinkedIn (@Invest-Safely)
Instagram (@investsafely)
Invest Safely, LLC is an independent investment research and online financial media company. Use of Invest Safely, LLC and any other products available through invest-safely.com is subject to our Terms of Service and Privacy Policy. Not a recommendation to buy or sell any security.
Charts provided courtesy of stockcharts.com.
For historical Elliott Wave commentary and analysis, go to ELLIOTT WAVE lives on by Tony Caldaro. Current counts can be found at: Pretzel Logic, and 12345ABCDEWXYZ
Once a year, I review the market outlook signals as if they were a mechanical trading system, while pointing out issues and making adjustments. The goal is to give you to give you an example of how to analyze and continuously improve your own systems.
- 2015 Performance - Stock Market Outlook
- 2016 Performance - Stock Market Outlook
- 2017 Performance - Stock Market Outlook
- 2018 Performance - Stock Market Outlook
- 2019 Performance - Stock Market Outlook
- 2020 Performance - Stock Market Outlook
IMPORTANT DISCLOSURE INFORMATION
This material is for general communication and is provided for informational and/or educational purposes only. None of the content should be viewed as a suggestion that you take or refrain from taking any action nor as a recommendation for any specific investment product, strategy, or other such purpose. Certain information contained herein has been obtained from third-party sources believed to be reliable, but we cannot guarantee its accuracy or completeness.
To the extent that a reader has any questions regarding the applicability of any specific issue discussed above to his/her individual situation, he/she is encouraged to consult with the professional advisors of his/her choosing. Invest Safely, LLC is not a law firm, certified public accounting firm, or registered investment advisor and no portion of its content should be construed as legal, accounting, or investment advice.
The material is not to be construed as an offer or a recommendation to buy or sell a security nor is it to be construed as investment advice. Additionally, the material accessible through this website does not constitute a representation that the investments described herein are suitable or appropriate for any person.
Hypothetical Presentations:
Any referenced performance is “as calculated” using the referenced funds and has not been independently verified. This presentation does not discuss, directly or indirectly, the amount of the profits or losses, realized or unrealized, by any reader or contributor, from any specific funds or securities.
The author and/or any reader may have experienced materially different performance based upon various factors during the corresponding time periods. To the extent that any portion of the content reflects hypothetical results that were achieved by means of the retroactive application of a back-tested model, such results have inherent limitations, including:
Model results do not reflect the results of actual trading using assets, but were achieved by means of the retroactive application of the referenced models, certain aspects of which may have been designed with the benefit of hindsight
Back-tested performance may not reflect the impact that any material market or economic factors might have had on the use of a trading model if the model had been used during the period to actually manage assets
Actual investment results during the corresponding time periods may have been materially different from those portrayed in the model
Past performance may not be indicative of future results. Therefore, no one should assume that future performance will be profitable, or equal to any corresponding historical index.
The S&P 500 Composite Total Return Index (the "S&P") is a market capitalization-weighted index of 500 widely held stocks often used as a proxy for the stock market. Standard & Poor's chooses the member companies for the S&P based on market size, liquidity, and industry group representation. Included are the common stocks of industrial, financial, utility, and transportation companies. The S&P is not an index into which an investor can directly invest. The historical S&P performance results (and those of all other indices) are provided exclusively for comparison purposes only, so as to provide general comparative information to assist an individual in determining whether the performance of a specific portfolio or model meets, or continues to meet investment objective(s). The model and indices performance results do not reflect the impact of taxes.
Investing involves risk (even the “safe” kind)! Past performance does not guarantee or indicate future results. Different types of investments involve varying degrees of underlying risk. Therefore, do not assume that future performance of any specific investment or investment strategy be suitable for your portfolio or individual situation, will be profitable, equal any historical performance level(s), or prove successful (including the investments and/or investment strategies describe on this site).
Investing Process Links
Stabilize- Organize your $$$
- Manage your $$$
Plan
- Why You Invest
- Ways to Invest
- Where to Invest
- What to Invest In
Execute
- When to Invest
- How Much to Invest
- Buying & Selling
Monitor
- Track The Market
- Track Your Returns
Reflect & Adjust
- Improve Your Returns
- Adjust your Holdings
Popular Pages
- Jim Cramer- Personal Incomes Statements
- Hyperinflation
- Calculating Beta
- SMART Financial Goals
Blogroll
- Advisor Perspectives- Dividend Growth Investor
- Elliott Wave Lives On
- On My Radar | CMG Wealth
- Sure Dividend
- The Big Picture
- The Fat Pitch
- Thoughts from the Frontline
- Trader Feed
Sponsored Links
Invest Safely provides valuable, time-saving info about personal finance, money management, and investing.


