Stock Market Outlook
For The Week Of March 9th =
Downtrend
INDICATORS
-
ADX Directional Indicators: Downtrend
Institutional Activity (Price & Volume): Downtrend
On Balance Volume Indicator: Downtrend
ANALYSIS
The stock market outlook remained in a downtrend last week after last week's rally attempt failed. Equities get a second chance this week, thanks to another strong Friday rally.
The S&P500 ( $SPX ) fell 3.1% last week and tested the 200 day moving average. The index is ~4% below the 50-day moving average and ~1% above the 200-day moving average.
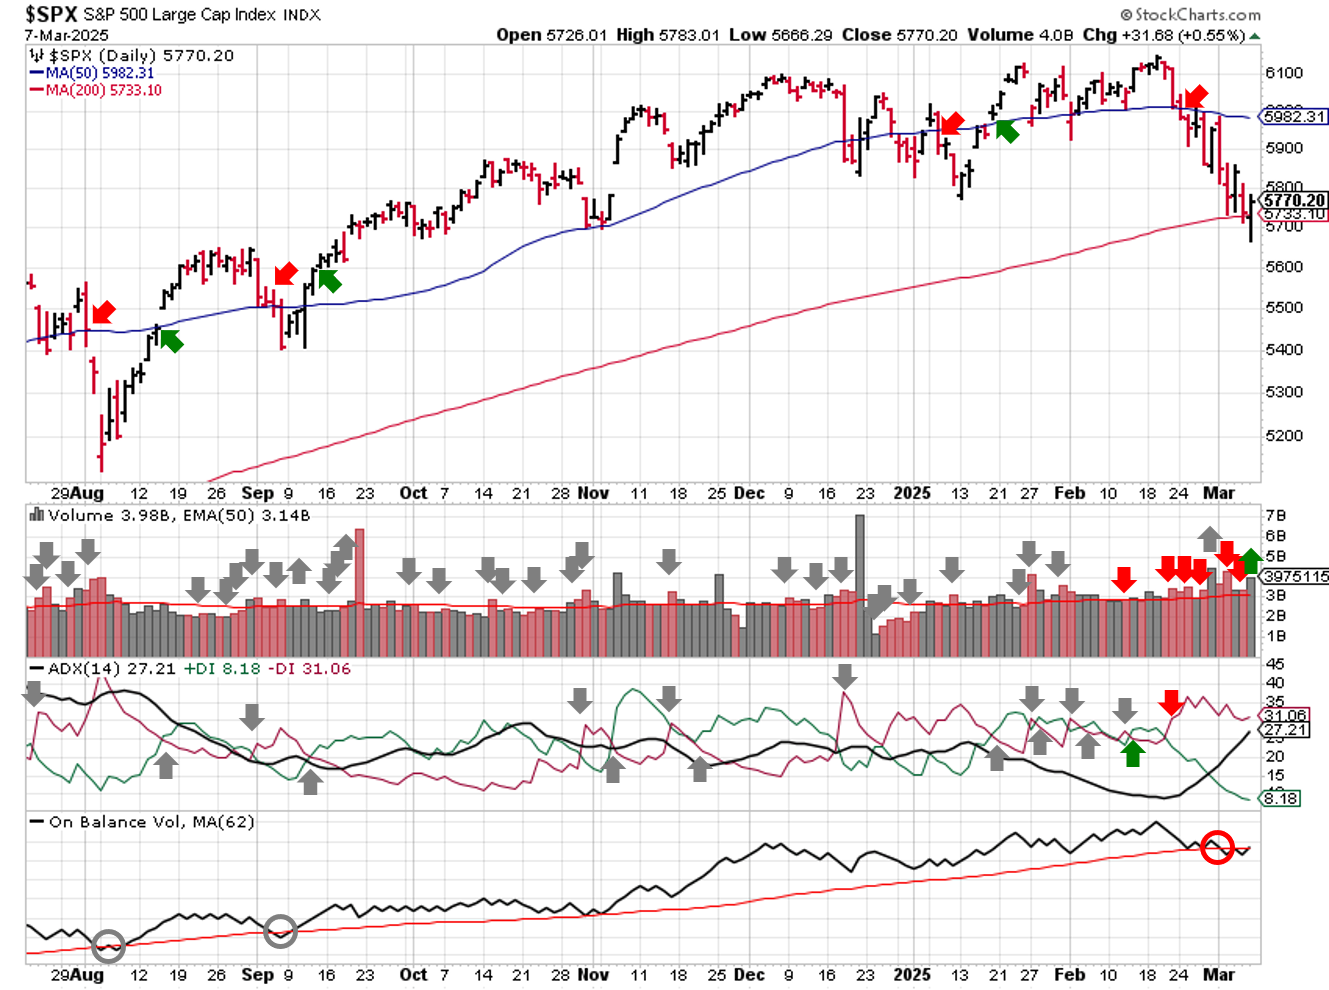
SPX Technical Analysis - March 09 2025
On-balance volume shifted to bearish last week, reflecting the high volume selling experienced since mid-February. Institutions weren't in a buying mood last week either, instead using the 2/28 rally attempt as a exit opportunity. The market will try again this week, after putting in another strong Friday session. That said, the ADX shows a strengthening downtrend taking hold as we entered the weekend.
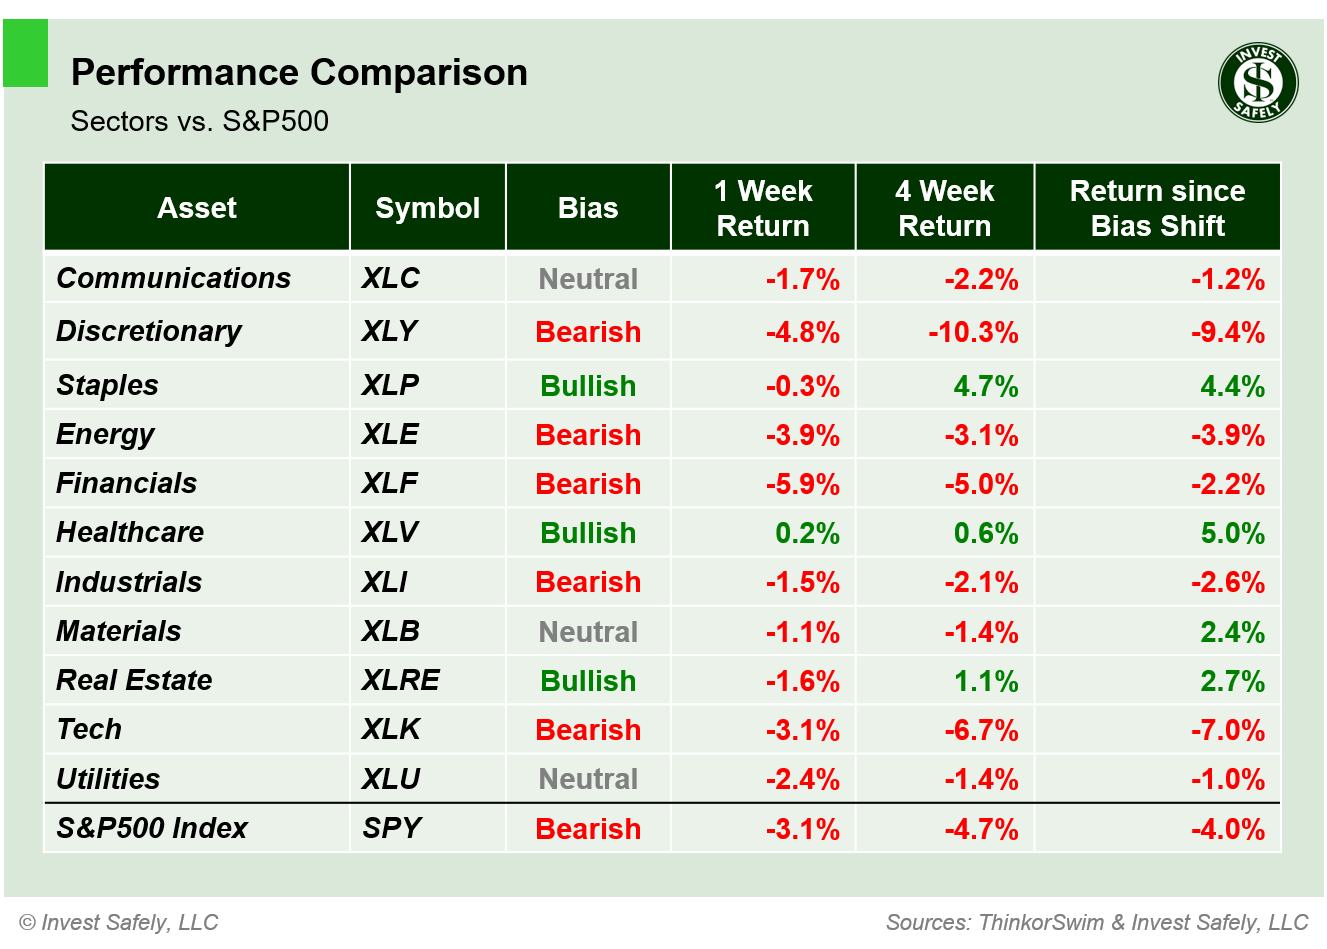
Healthcare ( $XLV ) was the only shelter from last week's sell-off, basically breaking even. Financials ( $XLF ) were the worst sector. The bias for Energy ( $XLE ), Financials ( $XLF ), and Industrials ( $XLI ) fell to bearish. Communications, Materials ( $XLB ), and Utilities are testing their support levels.
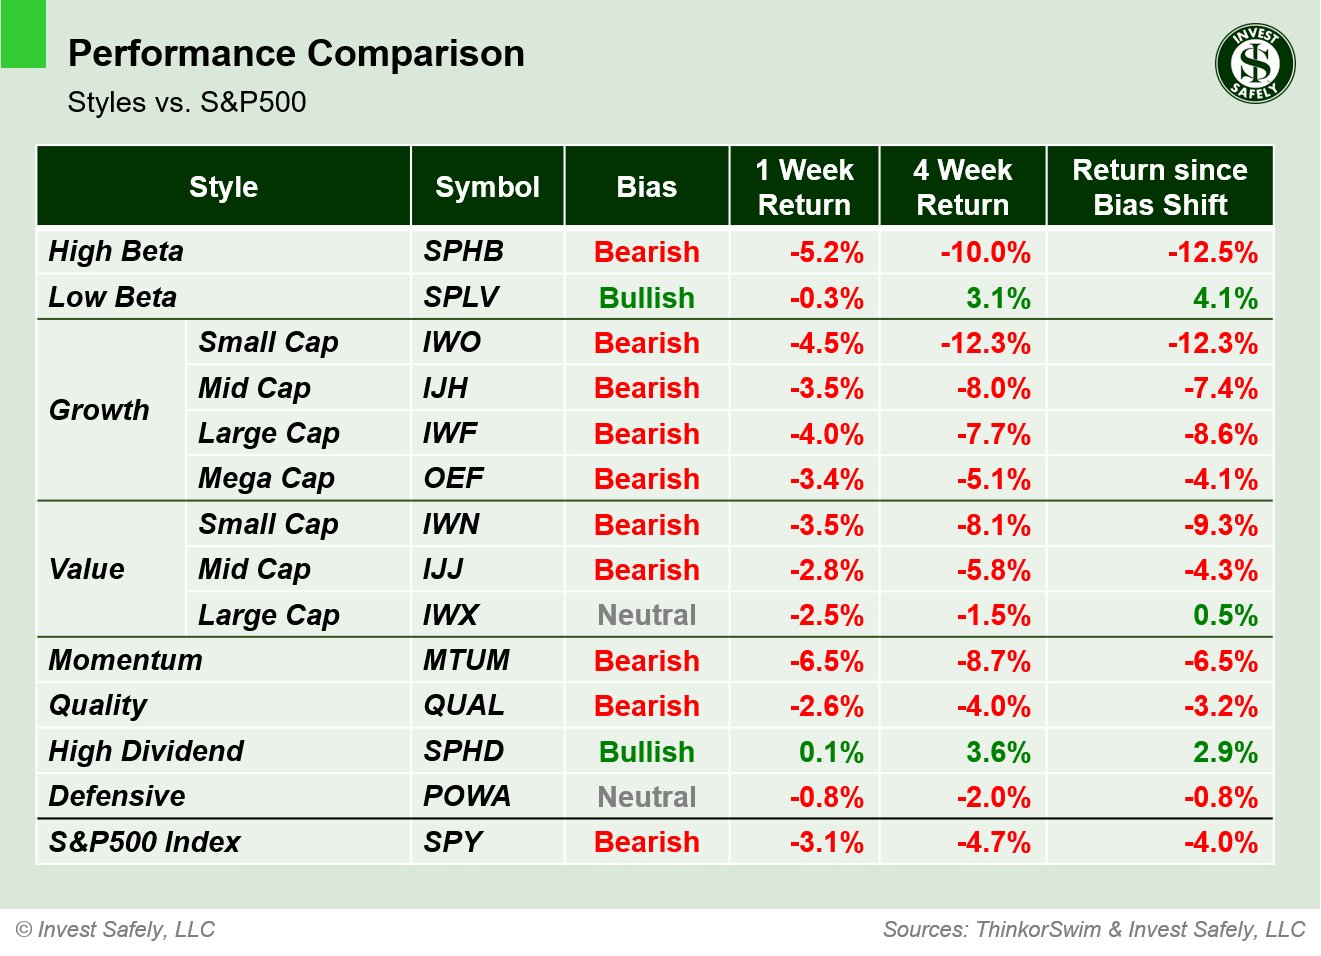
Like Healthcare, the High Dividend ( $SPHD ) sector style was the only winner last week. Mega-cap growth ( $OEF ), Momentum and Quality styles fell to bearish bias, while Large-cap value ( $IWX ) is testing support at a neutral bias.
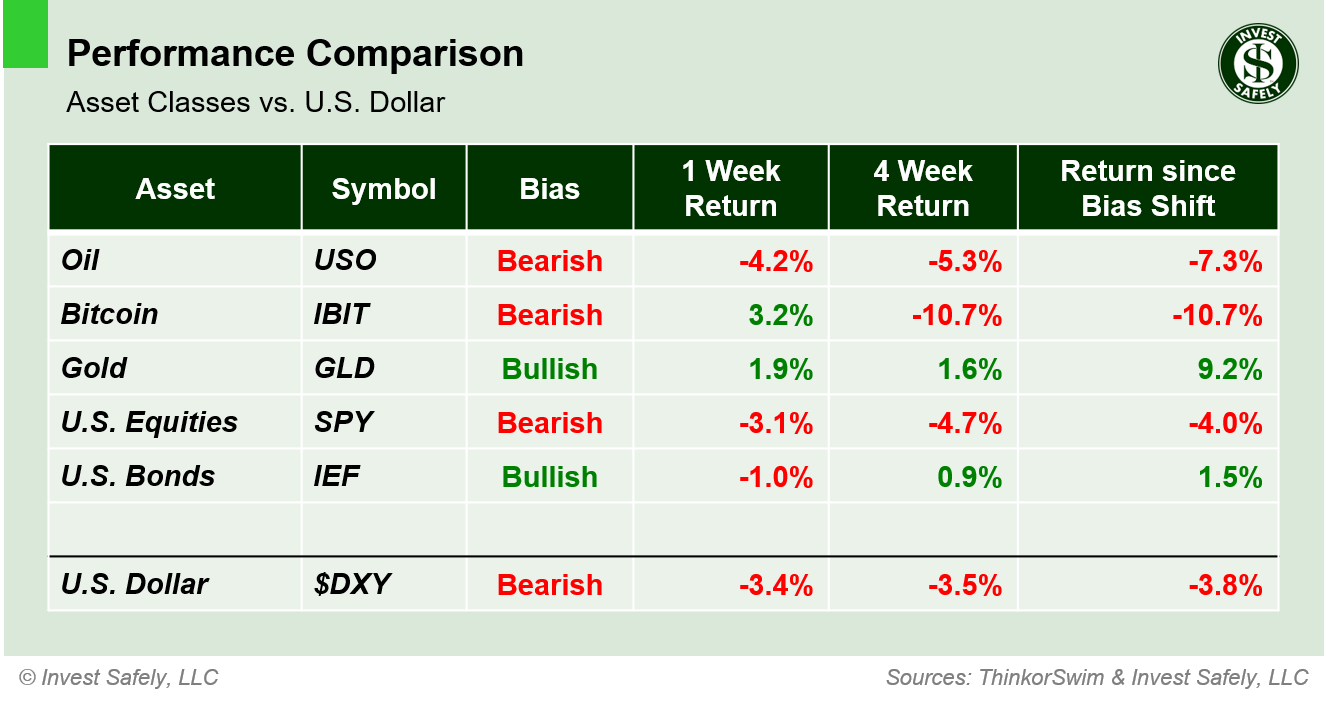
A bit of a comeback for Bitcoin; probably a response to all the crypto-related announcements out of Washington D.C. last week. Otherwise, Gold was the other safety play, while Oil led to the downside. The dollar also fell to bearish bias, thanks to an unusually large decline during the week.
COMMENTARY
First things first: the smart money is selling the rips, not buying the dips, which means U.S. equities are in sell mode. Whether it's initial or reciprocal tariffs, government upheaval, or geopolitical turmoil, the world is an increasingly uncertain place at this moment in time. And financial markets do not react well to uncertainty, so you're seeing risk-off trades.
Rising foreign currencies have pressured the U.S. Dollar in recent weeks, unwinding most of the post-election rally. Of greater interest is the bond market, specifically Germany's: yields on government bonds have spiked after they announced changes to their “debt brake” and an historic boost in spending. The increase in bond yields comes despite the European Central Bank cutting interest rates for the fifth time in a row and lowering its growth forecasts for the Eurozone; likely an attempt to mitigate the impact of tariffs. These developments impact the profitability of various carry trades, changing capital flows and volatility throughout the global financial system.
January macroeconomic data ( ISM PMI Surveys ) showed slightly lower manufacturing activity and slightly higher service-related activity. February non-farm payrolls showed a month over month increased, but fell short of forecasts. At a speech in Chicago, Federal Reserve Chairman Powell stated that "the US economy continues to be in a good place,” and while they aren't focused on the uncertainty caused by tariffs, they are waiting for more data to determine if and when interest rate adjustments are needed. So there's no "Fed put" at the moment.
If you're looking hold a position longer than a day or two, you want to buy the best of the best when you have the highest odds of success. Now is the time to prepare your watch lists for the next buying opportunity ( big up days with higher than average trading volumes, $VIX < 20, bullish bias, etc. ). There are only a few places with a bullish bias ( see above ), and their largely defensive in nature.
This week we get January JOLTs, February CPI & PPI, and March Consumer Sentiment.
Best to Your Week!
P.S. If you find this research helpful, please tell a friend.
If you don't, tell an enemy.
Sources: Bloomberg, CNBC, Federal Reserve Bank of St. Louis, Hedgeye, U.S. Bureau of Economic Analysis, U.S. Bureau of Labor Statistics
Share this Post on:

How to Make Money in Stocks: A Winning System in Good Times and Bad.
It's one of my favorites.
I regularly share articles and other news of interest on:
Twitter (@investsafely)
Facebook (@InvestSafely)
LinkedIn (@Invest-Safely)
Instagram (@investsafely)
Invest Safely, LLC is an independent investment research and online financial media company. Use of Invest Safely, LLC and any other products available through invest-safely.com is subject to our Terms of Service and Privacy Policy. Not a recommendation to buy or sell any security.
Charts provided courtesy of stockcharts.com.
For historical Elliott Wave commentary and analysis, go to ELLIOTT WAVE lives on by Tony Caldaro. Current counts can be found at: Pretzel Logic, and 12345ABCDEWXYZ
Once a year, I review the market outlook signals as if they were a mechanical trading system, while pointing out issues and making adjustments. The goal is to give you to give you an example of how to analyze and continuously improve your own systems.
- 2015 Performance - Stock Market Outlook
- 2016 Performance - Stock Market Outlook
- 2017 Performance - Stock Market Outlook
- 2018 Performance - Stock Market Outlook
- 2019 Performance - Stock Market Outlook
- 2020 Performance - Stock Market Outlook
IMPORTANT DISCLOSURE INFORMATION
This material is for general communication and is provided for informational and/or educational purposes only. None of the content should be viewed as a suggestion that you take or refrain from taking any action nor as a recommendation for any specific investment product, strategy, or other such purpose. Certain information contained herein has been obtained from third-party sources believed to be reliable, but we cannot guarantee its accuracy or completeness.
To the extent that a reader has any questions regarding the applicability of any specific issue discussed above to his/her individual situation, he/she is encouraged to consult with the professional advisors of his/her choosing. Invest Safely, LLC is not a law firm, certified public accounting firm, or registered investment advisor and no portion of its content should be construed as legal, accounting, or investment advice.
The material is not to be construed as an offer or a recommendation to buy or sell a security nor is it to be construed as investment advice. Additionally, the material accessible through this website does not constitute a representation that the investments described herein are suitable or appropriate for any person.
Hypothetical Presentations:
Any referenced performance is “as calculated” using the referenced funds and has not been independently verified. This presentation does not discuss, directly or indirectly, the amount of the profits or losses, realized or unrealized, by any reader or contributor, from any specific funds or securities.
The author and/or any reader may have experienced materially different performance based upon various factors during the corresponding time periods. To the extent that any portion of the content reflects hypothetical results that were achieved by means of the retroactive application of a back-tested model, such results have inherent limitations, including:
Model results do not reflect the results of actual trading using assets, but were achieved by means of the retroactive application of the referenced models, certain aspects of which may have been designed with the benefit of hindsight
Back-tested performance may not reflect the impact that any material market or economic factors might have had on the use of a trading model if the model had been used during the period to actually manage assets
Actual investment results during the corresponding time periods may have been materially different from those portrayed in the model
Past performance may not be indicative of future results. Therefore, no one should assume that future performance will be profitable, or equal to any corresponding historical index.
The S&P 500 Composite Total Return Index (the "S&P") is a market capitalization-weighted index of 500 widely held stocks often used as a proxy for the stock market. Standard & Poor's chooses the member companies for the S&P based on market size, liquidity, and industry group representation. Included are the common stocks of industrial, financial, utility, and transportation companies. The S&P is not an index into which an investor can directly invest. The historical S&P performance results (and those of all other indices) are provided exclusively for comparison purposes only, so as to provide general comparative information to assist an individual in determining whether the performance of a specific portfolio or model meets, or continues to meet investment objective(s). The model and indices performance results do not reflect the impact of taxes.
Investing involves risk (even the “safe” kind)! Past performance does not guarantee or indicate future results. Different types of investments involve varying degrees of underlying risk. Therefore, do not assume that future performance of any specific investment or investment strategy be suitable for your portfolio or individual situation, will be profitable, equal any historical performance level(s), or prove successful (including the investments and/or investment strategies describe on this site).
Investing Process Links
Stabilize- Organize your $$$
- Manage your $$$
Plan
- Why You Invest
- Ways to Invest
- Where to Invest
- What to Invest In
Execute
- When to Invest
- How Much to Invest
- Buying & Selling
Monitor
- Track The Market
- Track Your Returns
Reflect & Adjust
- Improve Your Returns
- Adjust your Holdings
Popular Pages
- Jim Cramer- Personal Incomes Statements
- Hyperinflation
- Calculating Beta
- SMART Financial Goals
Blogroll
- Advisor Perspectives- Dividend Growth Investor
- Elliott Wave Lives On
- On My Radar | CMG Wealth
- Sure Dividend
- The Big Picture
- The Fat Pitch
- Thoughts from the Frontline
- Trader Feed
Sponsored Links
Invest Safely provides valuable, time-saving info about personal finance, money management, and investing.


