Stock Market Outlook
For The Week Of February 2nd =
Uptrend
INDICATORS
-
ADX Directional Indicators: Uptrend
Institutional Activity (Price & Volume): Mixed
On Balance Volume Indicator: Uptrend
ANALYSIS
The stock market outlook remains in an uptrend.
The S&P500 ( $SPX ) fell 1% last week. The index is ~1% above the 50-day moving average and ~7% above the 200-day moving average.
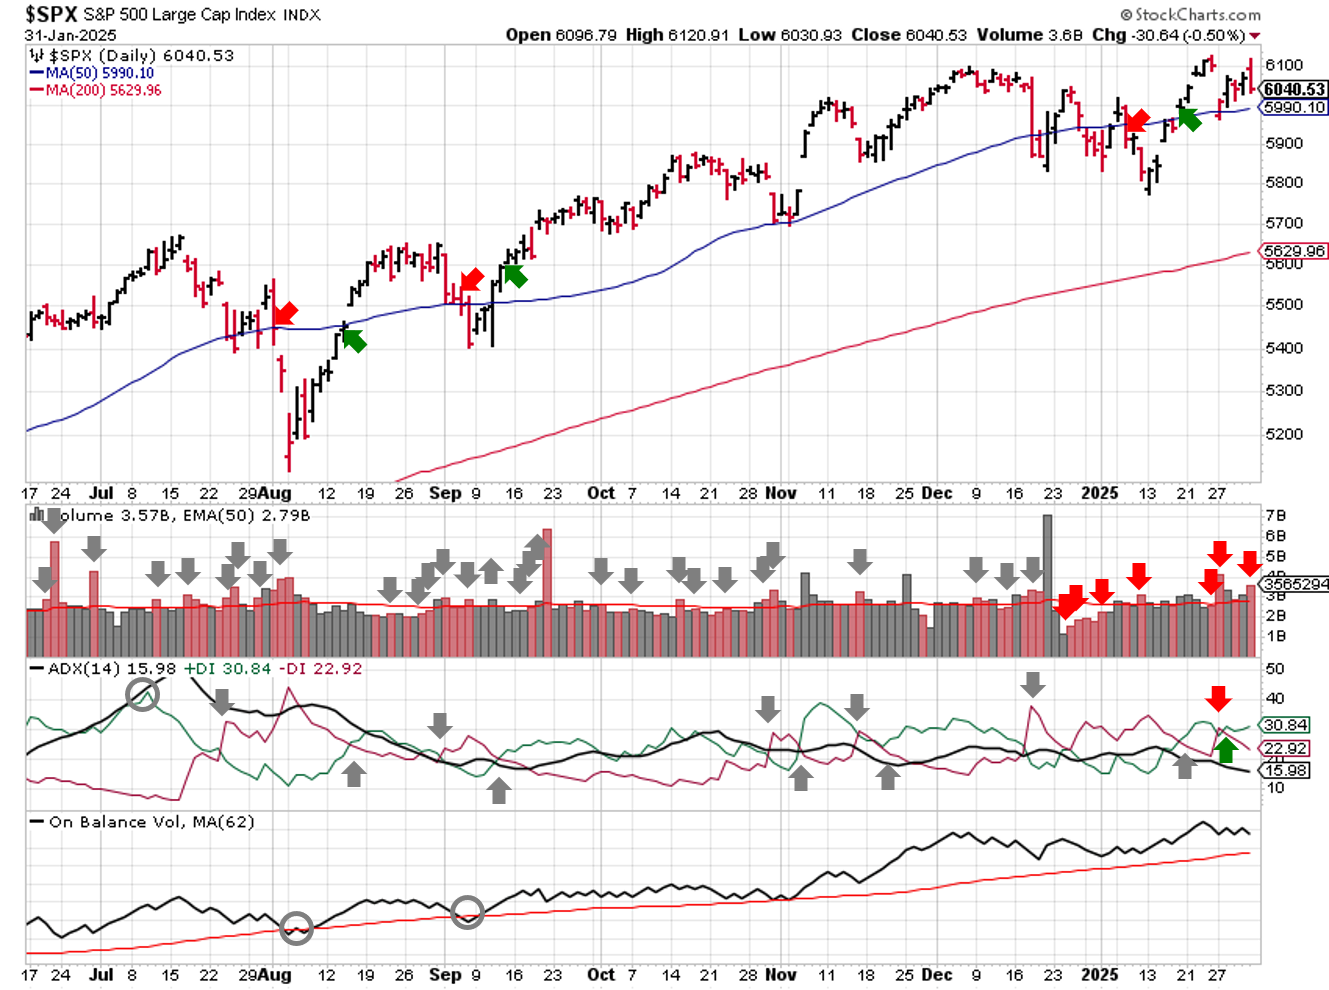
SPX Technical Analysis - February 02 2024
The ADX flip flopped early last week, thanks to high volatility. Institutional activity racked up another 2 days of high volume selling, taking the total to 7 and moving the signal to mixed. 2 days are set to leave the count early this week (potential positive), but the 50-day moving average is close at hand (potential negative).
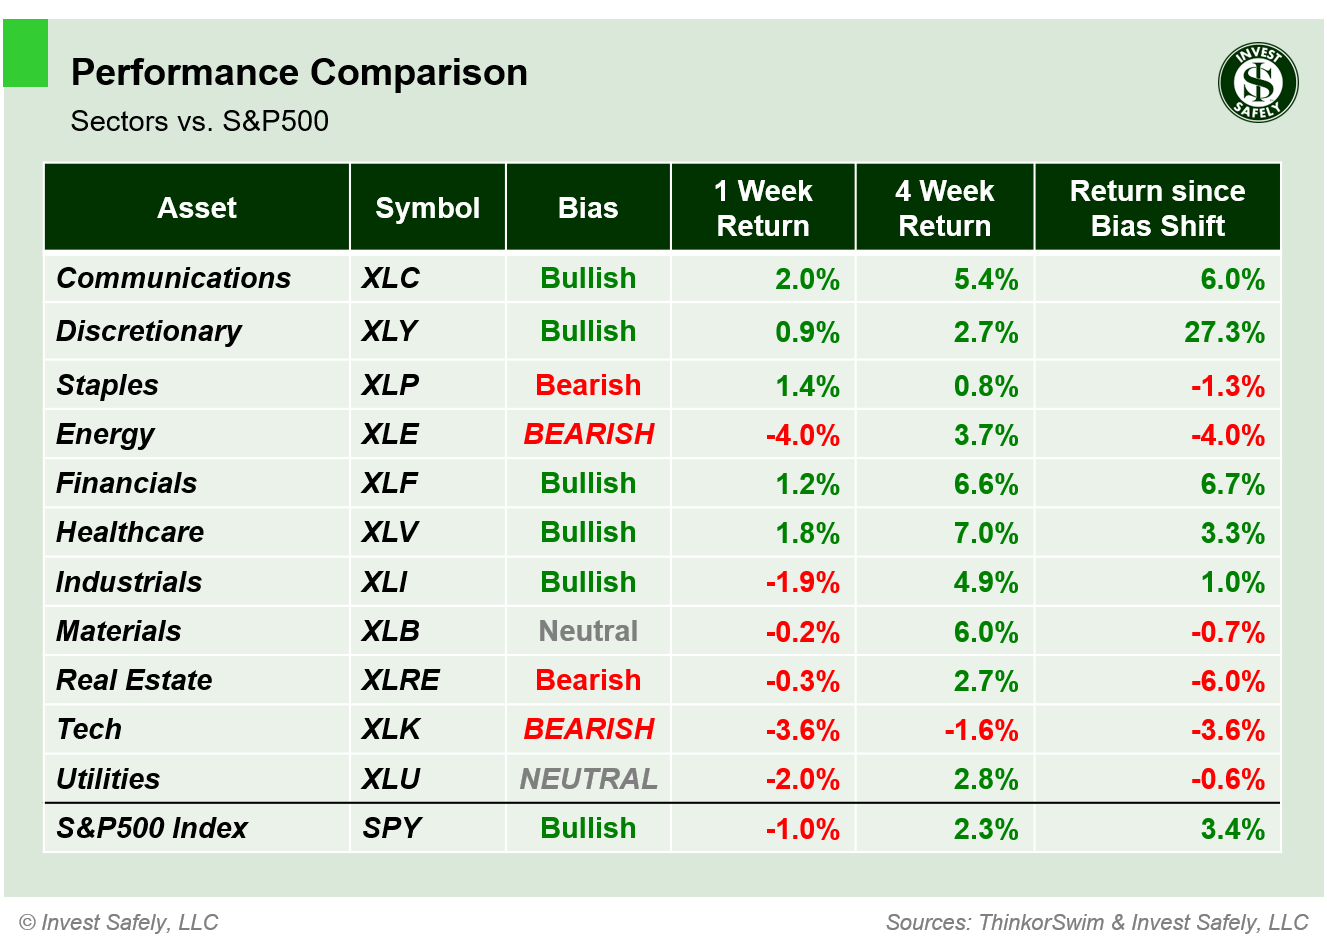
Communications ( $XLC ) led the way for a second week, while it was a tough week for Energy ( $XLE ) and Technology ( $XLK ) sectors. Energy fell back to a Bearish bias, along with Technology. Utilities downshifted to Neutral. Energy remains oversold, and Communications remains overbought.
Following the improvements last week, a few more sectors moved back to bullish bias: Healthcare, Industrials, and Technology. Materials tests a potential change at neutral. In the shorter-term, Communications, Consumer Staples, Financials, and Healthcare are overbought and Energy is oversold.
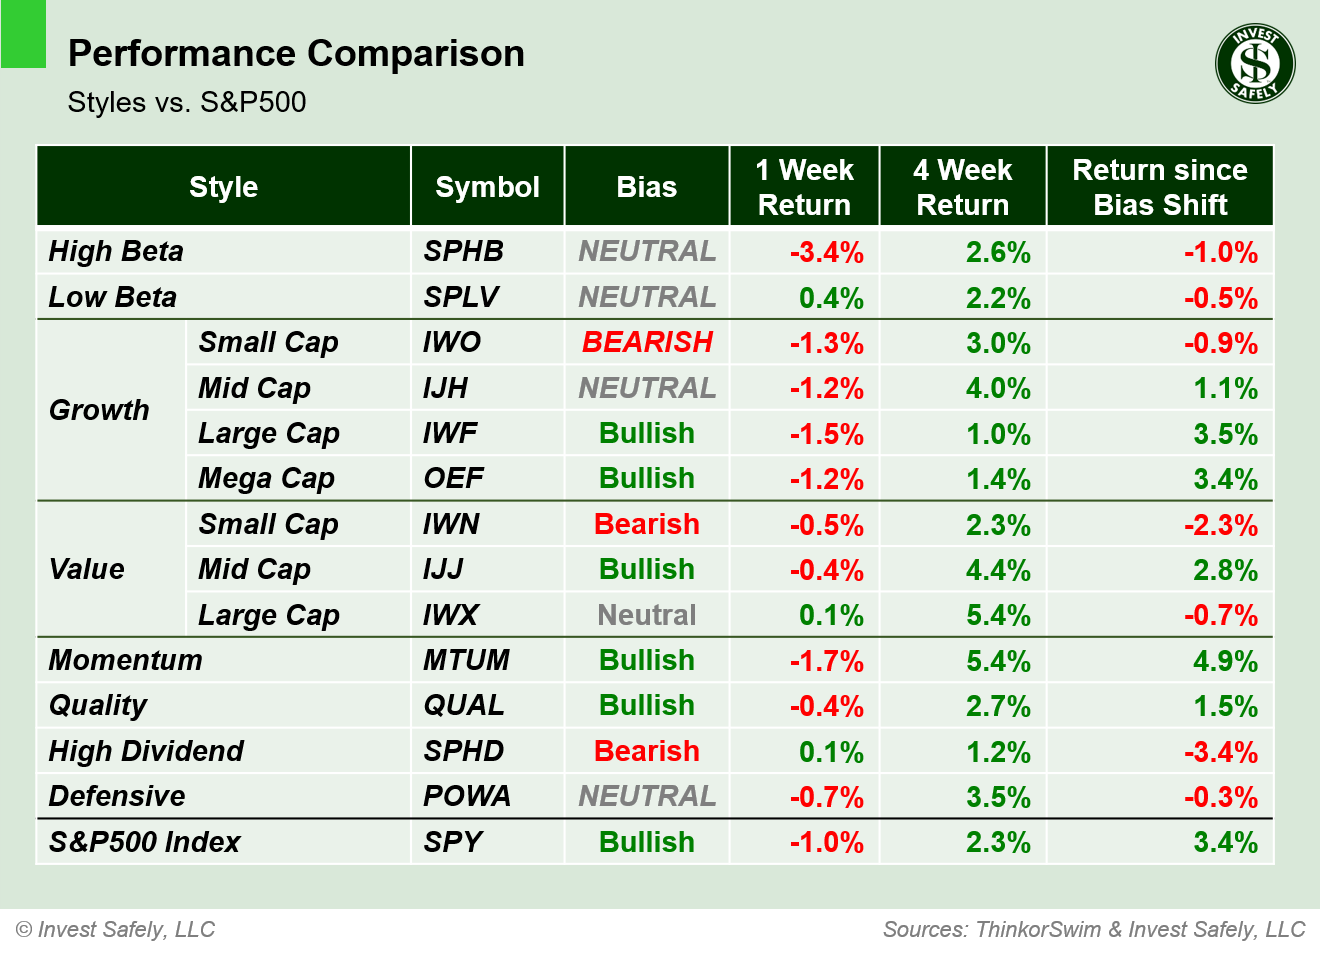
Low Beta equities were the best sector style last week, and upshifted to a neutral bias; Momentum stocks were the worst. A few more bias changes to note: High Beta, Mid Cap Growth, and Defensive downshifted to Neutral, while Small Cap Growth moved to bearish.
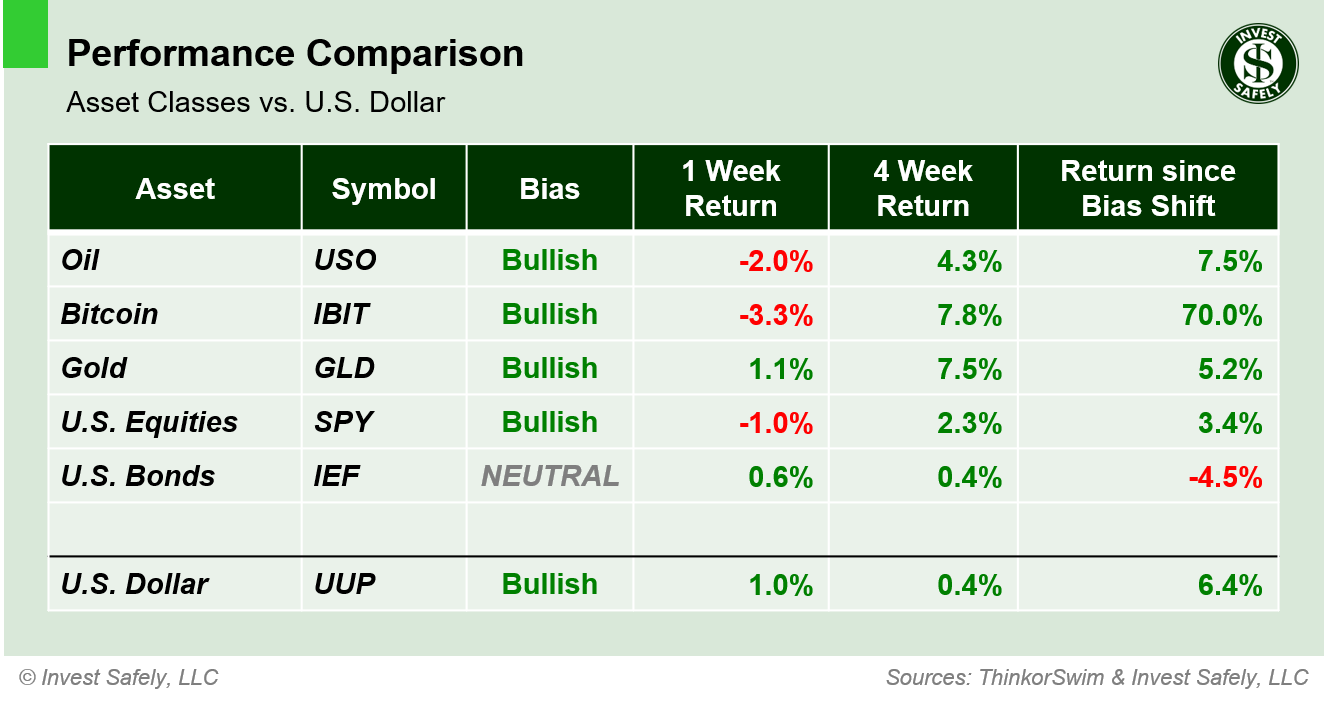
Bitcoin ( $IBIT ) was the worst performer last week, while Gold ( $GLD ) and the U.S. Dollar outperformed. Bonds shifted to a neutral bias.
COMMENTARY
Last week was quite a year. FOMC kept rates unchanged, pausing the rate-cutting cycle they started in September. They cited rationale including: solid economic activity, stabilized unemployment, and "somewhat elevated" inflation.
The advanced (1st) GDP estimate for 2024 Q4 came in lower than expected (2.3% vs 2.6% expected), which is down almost a full percent from 2023 Q4. Not recession territory, but still slowing growth.
PCE was up 20 basis points year over year; core was flat and hasn't changed since October.
| PCE (y/y) | Actual | Prior | Expected |
| Headline | +2.6% | +2.4% | +2.6% |
| Core | +2.8% | +2.8% | +2.9% |
Most impactful to Monday's open are President Trump's tariffs on Mexico, Canada and China. Per the executive orders, effective February 4, 2025, the United States will impose a:
- 25% tariff generally on all imports from Mexico
- 25% tariff generally on all imports from Canada, except for “energy resources” which have a 10% tariff
- 10% tariff on all imports from China
All three countries announced retaliatory measures are in the works.
On Friday, Reuters posted an article about a possible delay for tariffs, which sent equities higher during the morning. However, the White House shot down that story midday, and the indexes sold-off hard from there. Many investors are looking to Monday, hoping for a reverse "buy the rumor, sell the news" effect.
As always: we cannot predict, we can only prepare. You've probably noticed a lot of whipsaws your the signals going back to early December, which means it's been a traders market (rather than a buy and hold or long-term allocator). Last week was no different, and Monday will probably be more of the same. Futures just opened and the indexes are down ~1.5%.
Protect your capital, keep your losses small, and deploy capital when probabilities are in your favor (oversold in bullish trends).
Best to Your Week, and Happy New Year!
P.S. If you find this research helpful, please tell a friend.
If you don't, tell an enemy.
Sources: Bloomberg, CNBC, Federal Reserve Bank of St. Louis, Hedgeye, U.S. Bureau of Economic Analysis, U.S. Bureau of Labor Statistics
Share this Post on:

How to Make Money in Stocks: A Winning System in Good Times and Bad.
It's one of my favorites.
I regularly share articles and other news of interest on:
Twitter (@investsafely)
Facebook (@InvestSafely)
LinkedIn (@Invest-Safely)
Instagram (@investsafely)
Invest Safely, LLC is an independent investment research and online financial media company. Use of Invest Safely, LLC and any other products available through invest-safely.com is subject to our Terms of Service and Privacy Policy. Not a recommendation to buy or sell any security.
Charts provided courtesy of stockcharts.com.
For historical Elliott Wave commentary and analysis, go to ELLIOTT WAVE lives on by Tony Caldaro. Current counts can be found at: Pretzel Logic, and 12345ABCDEWXYZ
Once a year, I review the market outlook signals as if they were a mechanical trading system, while pointing out issues and making adjustments. The goal is to give you to give you an example of how to analyze and continuously improve your own systems.
- 2015 Performance - Stock Market Outlook
- 2016 Performance - Stock Market Outlook
- 2017 Performance - Stock Market Outlook
- 2018 Performance - Stock Market Outlook
- 2019 Performance - Stock Market Outlook
- 2020 Performance - Stock Market Outlook
IMPORTANT DISCLOSURE INFORMATION
This material is for general communication and is provided for informational and/or educational purposes only. None of the content should be viewed as a suggestion that you take or refrain from taking any action nor as a recommendation for any specific investment product, strategy, or other such purpose. Certain information contained herein has been obtained from third-party sources believed to be reliable, but we cannot guarantee its accuracy or completeness.
To the extent that a reader has any questions regarding the applicability of any specific issue discussed above to his/her individual situation, he/she is encouraged to consult with the professional advisors of his/her choosing. Invest Safely, LLC is not a law firm, certified public accounting firm, or registered investment advisor and no portion of its content should be construed as legal, accounting, or investment advice.
The material is not to be construed as an offer or a recommendation to buy or sell a security nor is it to be construed as investment advice. Additionally, the material accessible through this website does not constitute a representation that the investments described herein are suitable or appropriate for any person.
Hypothetical Presentations:
Any referenced performance is “as calculated” using the referenced funds and has not been independently verified. This presentation does not discuss, directly or indirectly, the amount of the profits or losses, realized or unrealized, by any reader or contributor, from any specific funds or securities.
The author and/or any reader may have experienced materially different performance based upon various factors during the corresponding time periods. To the extent that any portion of the content reflects hypothetical results that were achieved by means of the retroactive application of a back-tested model, such results have inherent limitations, including:
Model results do not reflect the results of actual trading using assets, but were achieved by means of the retroactive application of the referenced models, certain aspects of which may have been designed with the benefit of hindsight
Back-tested performance may not reflect the impact that any material market or economic factors might have had on the use of a trading model if the model had been used during the period to actually manage assets
Actual investment results during the corresponding time periods may have been materially different from those portrayed in the model
Past performance may not be indicative of future results. Therefore, no one should assume that future performance will be profitable, or equal to any corresponding historical index.
The S&P 500 Composite Total Return Index (the "S&P") is a market capitalization-weighted index of 500 widely held stocks often used as a proxy for the stock market. Standard & Poor's chooses the member companies for the S&P based on market size, liquidity, and industry group representation. Included are the common stocks of industrial, financial, utility, and transportation companies. The S&P is not an index into which an investor can directly invest. The historical S&P performance results (and those of all other indices) are provided exclusively for comparison purposes only, so as to provide general comparative information to assist an individual in determining whether the performance of a specific portfolio or model meets, or continues to meet investment objective(s). The model and indices performance results do not reflect the impact of taxes.
Investing involves risk (even the “safe” kind)! Past performance does not guarantee or indicate future results. Different types of investments involve varying degrees of underlying risk. Therefore, do not assume that future performance of any specific investment or investment strategy be suitable for your portfolio or individual situation, will be profitable, equal any historical performance level(s), or prove successful (including the investments and/or investment strategies describe on this site).
Investing Process Links
Stabilize- Organize your $$$
- Manage your $$$
Plan
- Why You Invest
- Ways to Invest
- Where to Invest
- What to Invest In
Execute
- When to Invest
- How Much to Invest
- Buying & Selling
Monitor
- Track The Market
- Track Your Returns
Reflect & Adjust
- Improve Your Returns
- Adjust your Holdings
Popular Pages
- Jim Cramer- Personal Incomes Statements
- Hyperinflation
- Calculating Beta
- SMART Financial Goals
Blogroll
- Advisor Perspectives- Dividend Growth Investor
- Elliott Wave Lives On
- On My Radar | CMG Wealth
- Sure Dividend
- The Big Picture
- The Fat Pitch
- Thoughts from the Frontline
- Trader Feed
Sponsored Links
Invest Safely provides valuable, time-saving info about personal finance, money management, and investing.


