Stock Market Outlook
For The Week Of September 29th =
Uptrend
INDICATORS
-
ADX Directional Indicators: Uptrend
On Balance Volume Indicator: Uptrend
Institutional Activity (Price & Volume): Uptrend
ANALYSIS
The stock market outlook shows an uptrend in place as we close out the third quarter.
The S&P500 ($SPX) rallied 0.6% last week. The index sits ~4% above the 50-day moving average and ~10% above the 200-day moving average.
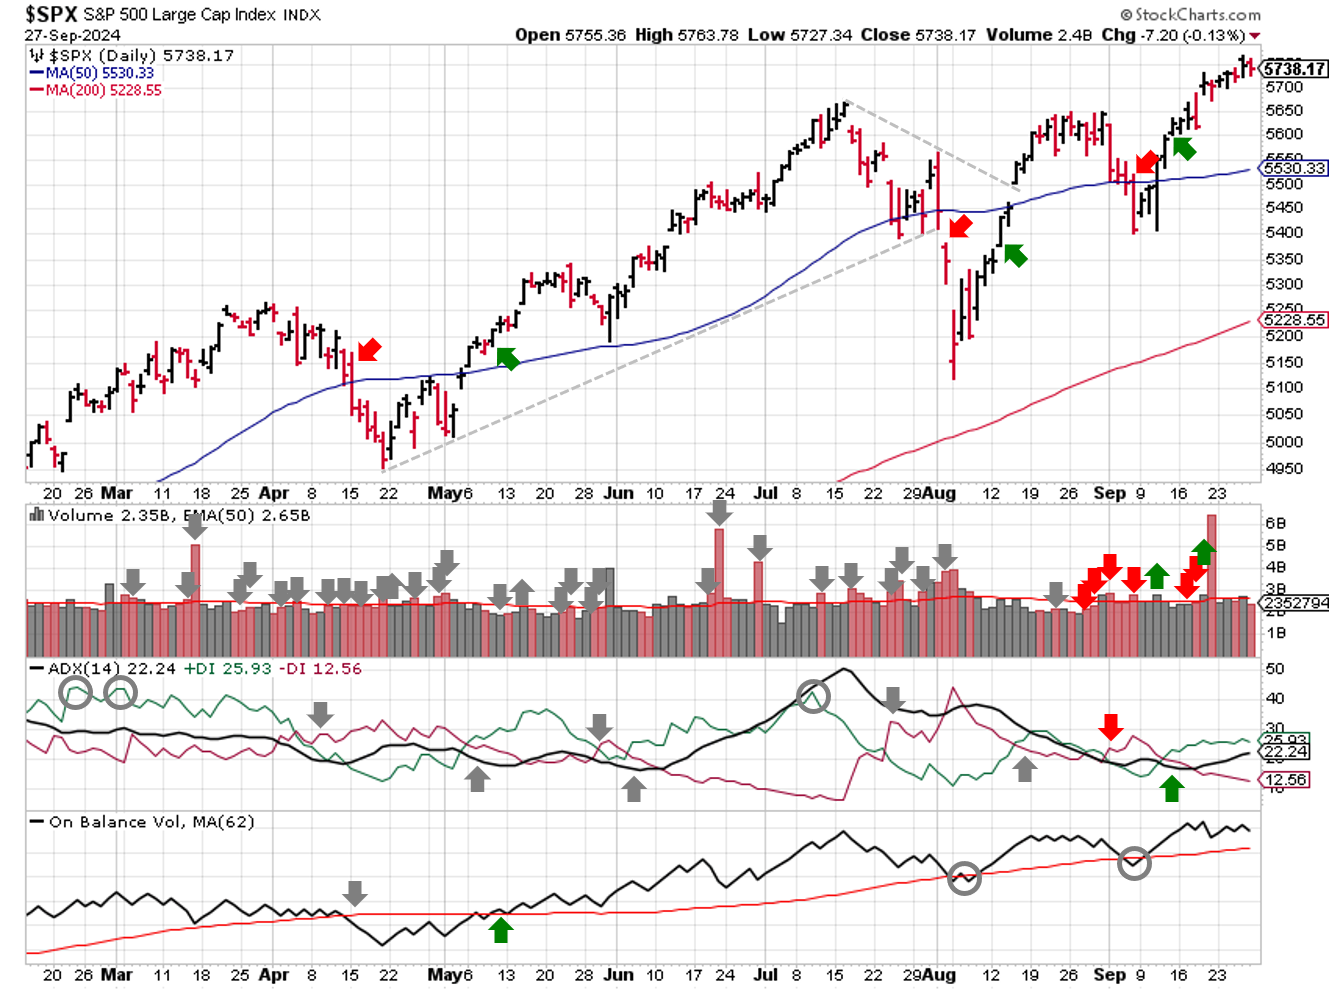
SPX Technical Analysis - September 22 2024
All three indicators (Average Directional Index, On-Balance Volume, and Institutional Activity) remained bullish last week.
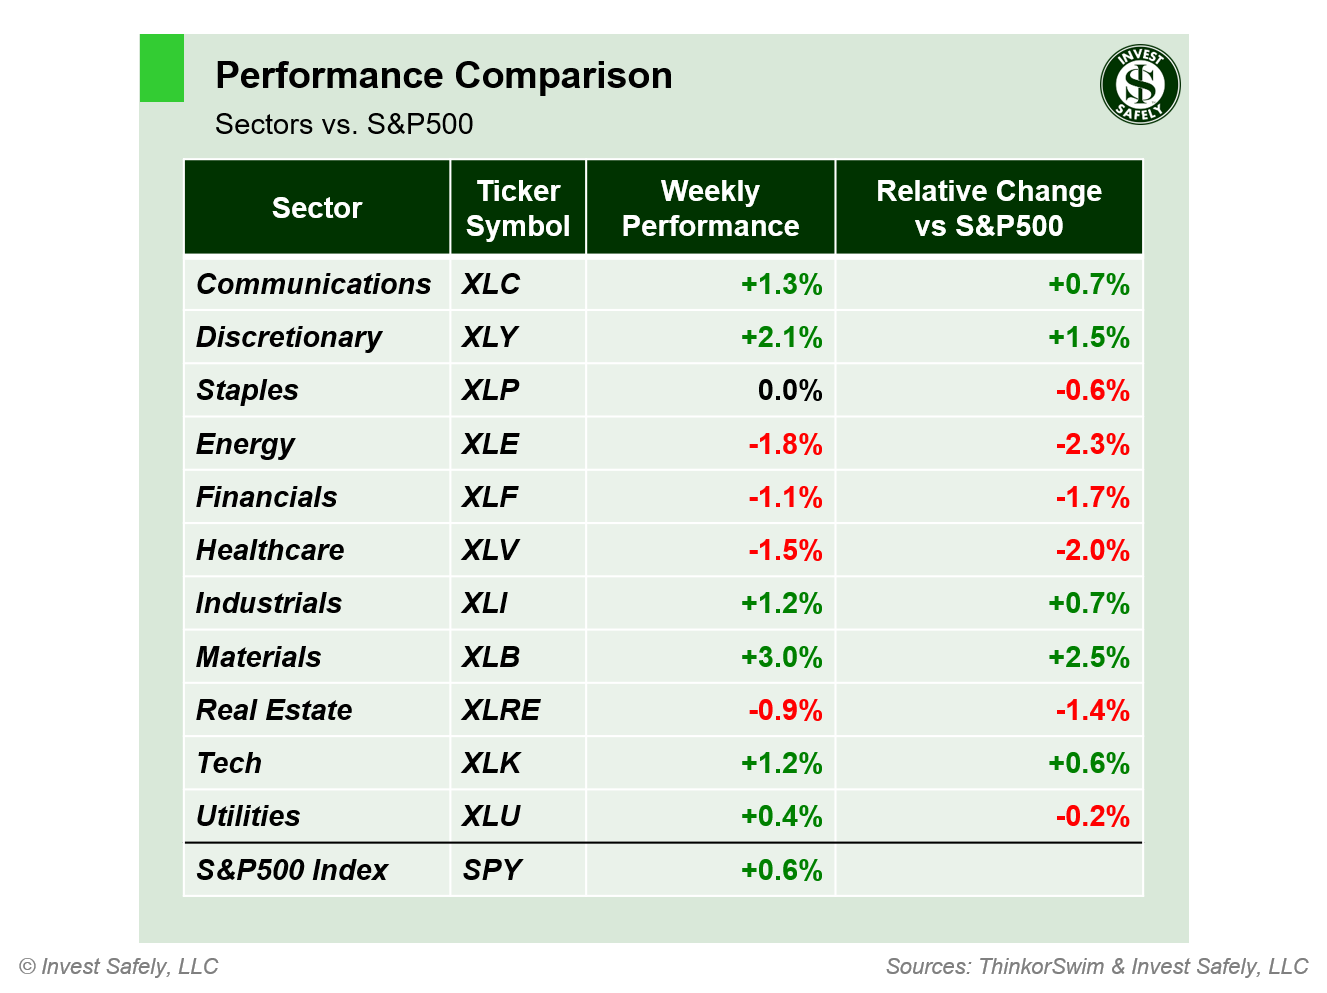
Materials ($XLB) outperformed the broader market last week, reflecting the strength in commodities (excluding oil and gas) and perhaps frontrunning money spent supporting regional rebuilding efforts after hurricane Helene. Energy ($XLE) was the laggard, thanks in large part to the weakness in oil and gas.
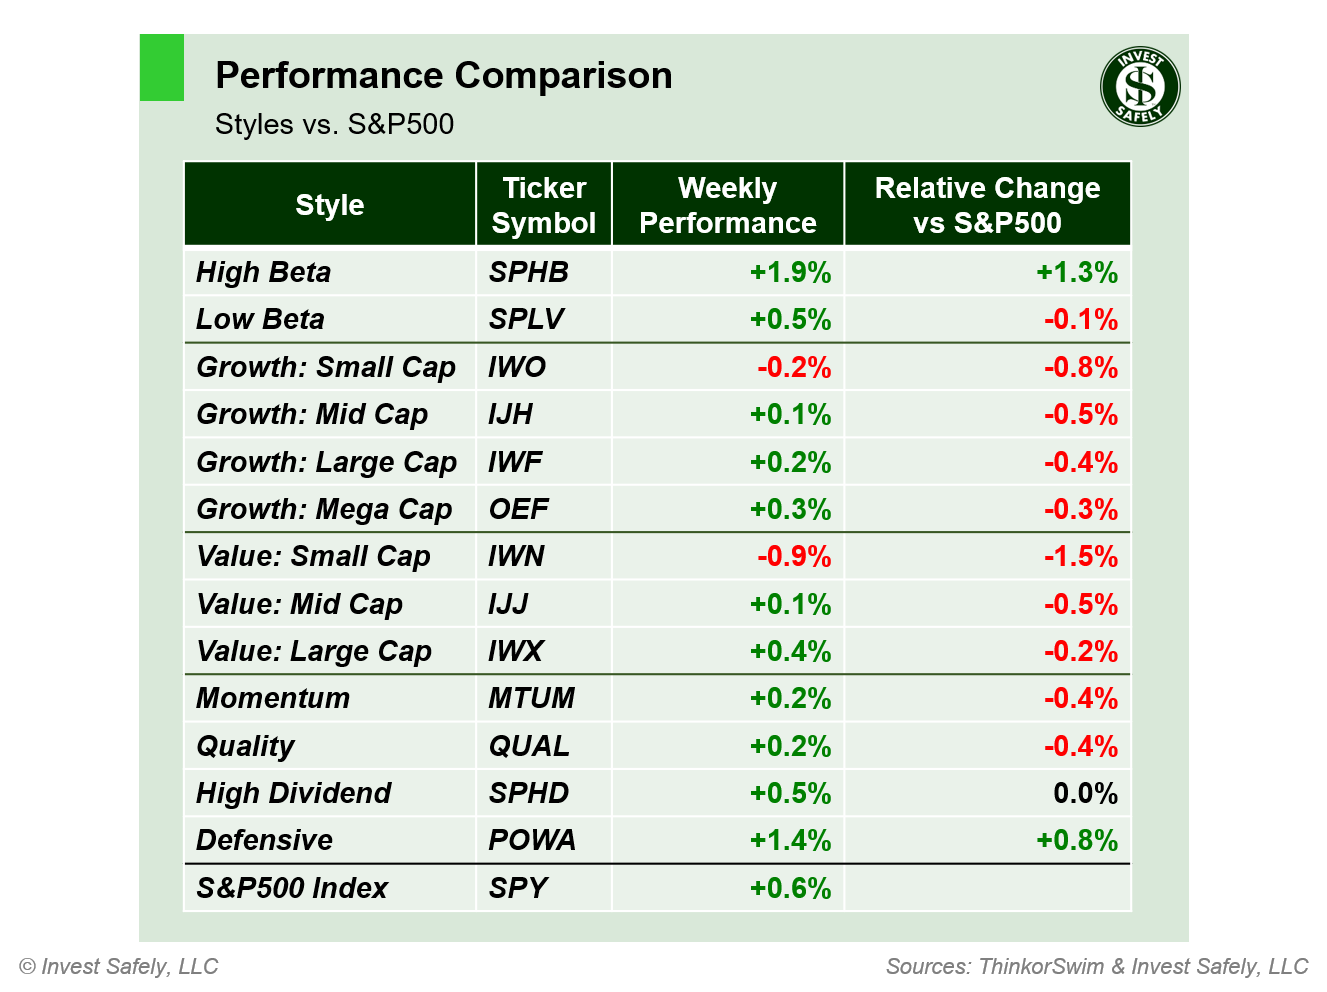
Style-wise, High Beta ($SPHB) was the best sector for the third week in a row, while small cap value ($IWN) was the worst performer. Risk-on indeed.
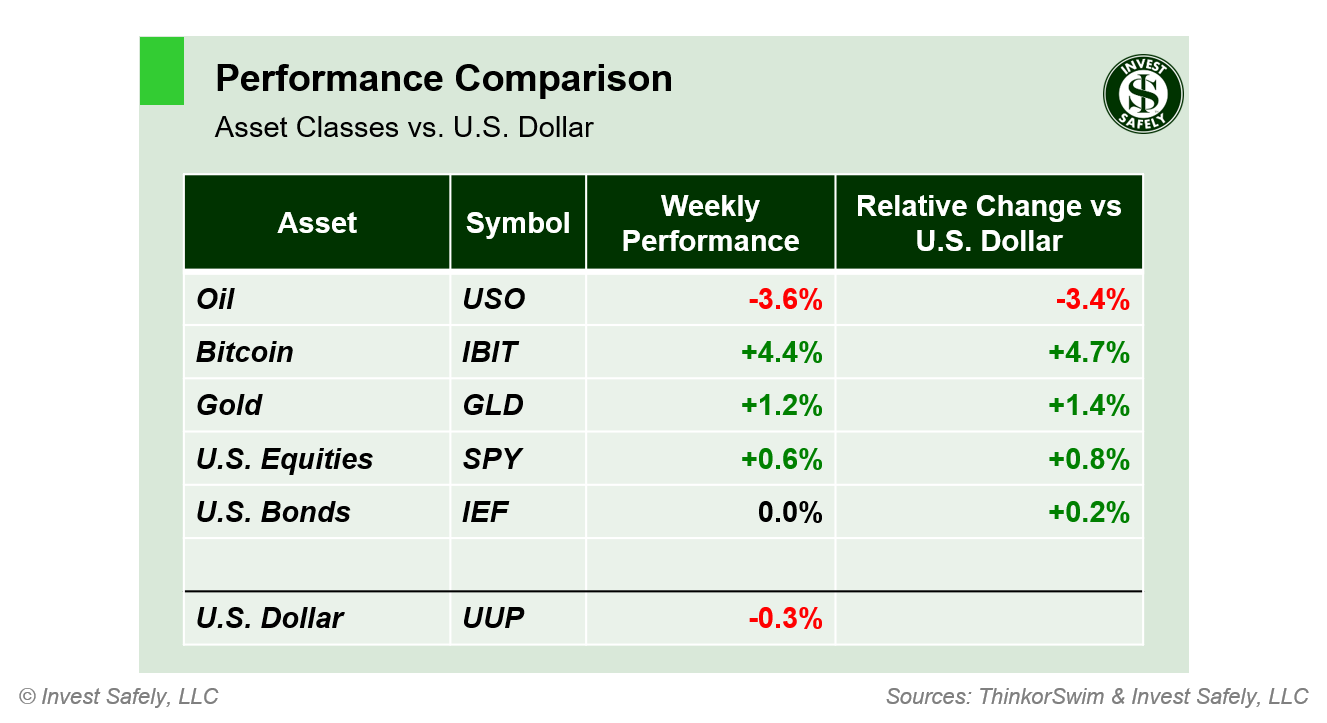
Also benefiting from the risk-on trade was Bitcoin, which led asset class returns for the third week in a row. Oil underperformed.
COMMENTARY
The final Q2 GDP reading showed an increase of 3% quarter / quarter; almost double the first quarter increase of +1.6% q/q, and outpacing the Q2 2023 figure of +2.4%. With Q3 already in the books, any "hard landing" data won't hit the official measures until sometime in the 4th quarter.
Headline PCE from August showed inflation dropping a bit more than expected, while core was inline (thought slightly higher vs. July).
| PCE (y/y) | Actual | Prior | Expected |
| Headline | +2.2% | +2.5% | +2.3% |
| Core | +2.7% | +2.6% | +2.7% |
But no one cares about inflation anymore. September labor data is due out this week, which is the new "king" of all things rate cut related, along with the latest ISM survey data for manufacturing and services.
So far, increased geopolitical "activity" in the Middle East hasn't significantly impacted major markets or economies. Regional conflicts have a way of creating unintended consequences outside the region, and there are several fronts that are currently "hot".
Closer to home, workers at East and Gulf Coast ports at set to strike on Tuesday, essentially freezing ports from New England all the way to Texas. Negotiations between the International Longshoremen’s Association and the U.S. Maritime Alliance haven't progressed in months, with neither side meeting in person since the summer. The strike will strand container goods, from produce to electronics, as no one will be loading or unloading the ships. Even a short stoppage could impact corporate earnings in the coming months, not to mention prices paid by consumers.
Best to Your Week!
P.S. If you find this research helpful, please tell a friend.
If you don't, tell an enemy.
Sources: Bloomberg, CNBC, Federal Reserve Bank of St. Louis, Hedgeye, U.S. Bureau of Economic Analysis, U.S. Bureau of Labor Statistics
Share this Post on:

How to Make Money in Stocks: A Winning System in Good Times and Bad.
It's one of my favorites.
I regularly share articles and other news of interest on:
Twitter (@investsafely)
Facebook (@InvestSafely)
LinkedIn (@Invest-Safely)
Instagram (@investsafely)
Invest Safely, LLC is an independent investment research and online financial media company. Use of Invest Safely, LLC and any other products available through invest-safely.com is subject to our Terms of Service and Privacy Policy. Not a recommendation to buy or sell any security.
Charts provided courtesy of stockcharts.com.
For historical Elliott Wave commentary and analysis, go to ELLIOTT WAVE lives on by Tony Caldaro. Current counts can be found at: Pretzel Logic, and 12345ABCDEWXYZ
Once a year, I review the market outlook signals as if they were a mechanical trading system, while pointing out issues and making adjustments. The goal is to give you to give you an example of how to analyze and continuously improve your own systems.
- 2015 Performance - Stock Market Outlook
- 2016 Performance - Stock Market Outlook
- 2017 Performance - Stock Market Outlook
- 2018 Performance - Stock Market Outlook
- 2019 Performance - Stock Market Outlook
- 2020 Performance - Stock Market Outlook
IMPORTANT DISCLOSURE INFORMATION
This material is for general communication and is provided for informational and/or educational purposes only. None of the content should be viewed as a suggestion that you take or refrain from taking any action nor as a recommendation for any specific investment product, strategy, or other such purpose. Certain information contained herein has been obtained from third-party sources believed to be reliable, but we cannot guarantee its accuracy or completeness.
To the extent that a reader has any questions regarding the applicability of any specific issue discussed above to his/her individual situation, he/she is encouraged to consult with the professional advisors of his/her choosing. Invest Safely, LLC is not a law firm, certified public accounting firm, or registered investment advisor and no portion of its content should be construed as legal, accounting, or investment advice.
The material is not to be construed as an offer or a recommendation to buy or sell a security nor is it to be construed as investment advice. Additionally, the material accessible through this website does not constitute a representation that the investments described herein are suitable or appropriate for any person.
Hypothetical Presentations:
Any referenced performance is “as calculated” using the referenced funds and has not been independently verified. This presentation does not discuss, directly or indirectly, the amount of the profits or losses, realized or unrealized, by any reader or contributor, from any specific funds or securities.
The author and/or any reader may have experienced materially different performance based upon various factors during the corresponding time periods. To the extent that any portion of the content reflects hypothetical results that were achieved by means of the retroactive application of a back-tested model, such results have inherent limitations, including:
Model results do not reflect the results of actual trading using assets, but were achieved by means of the retroactive application of the referenced models, certain aspects of which may have been designed with the benefit of hindsight
Back-tested performance may not reflect the impact that any material market or economic factors might have had on the use of a trading model if the model had been used during the period to actually manage assets
Actual investment results during the corresponding time periods may have been materially different from those portrayed in the model
Past performance may not be indicative of future results. Therefore, no one should assume that future performance will be profitable, or equal to any corresponding historical index.
The S&P 500 Composite Total Return Index (the "S&P") is a market capitalization-weighted index of 500 widely held stocks often used as a proxy for the stock market. Standard & Poor's chooses the member companies for the S&P based on market size, liquidity, and industry group representation. Included are the common stocks of industrial, financial, utility, and transportation companies. The S&P is not an index into which an investor can directly invest. The historical S&P performance results (and those of all other indices) are provided exclusively for comparison purposes only, so as to provide general comparative information to assist an individual in determining whether the performance of a specific portfolio or model meets, or continues to meet investment objective(s). The model and indices performance results do not reflect the impact of taxes.
Investing involves risk (even the “safe” kind)! Past performance does not guarantee or indicate future results. Different types of investments involve varying degrees of underlying risk. Therefore, do not assume that future performance of any specific investment or investment strategy be suitable for your portfolio or individual situation, will be profitable, equal any historical performance level(s), or prove successful (including the investments and/or investment strategies describe on this site).
Investing Process Links
Stabilize- Organize your $$$
- Manage your $$$
Plan
- Why You Invest
- Ways to Invest
- Where to Invest
- What to Invest In
Execute
- When to Invest
- How Much to Invest
- Buying & Selling
Monitor
- Track The Market
- Track Your Returns
Reflect & Adjust
- Improve Your Returns
- Adjust your Holdings
Popular Pages
- Jim Cramer- Personal Incomes Statements
- Hyperinflation
- Calculating Beta
- SMART Financial Goals
Blogroll
- Advisor Perspectives- Dividend Growth Investor
- Elliott Wave Lives On
- On My Radar | CMG Wealth
- Sure Dividend
- The Big Picture
- The Fat Pitch
- Thoughts from the Frontline
- Trader Feed
Sponsored Links
Invest Safely provides valuable, time-saving info about personal finance, money management, and investing.


