Stock Market Outlook
For The Week Of August 18th =
Uptrend
INDICATORS
-
ADX Directional Indicators: Uptrend
Price & Volume Action: Uptrend
On Balance Volume Indicator: Uptrend
The stock market outlook returned to an uptrend last Tuesday, after a very brief correction.
The S&P500 ($SPX) rose 3.9% last week. The index sits ~2% above the 50-day moving average and ~10% above the 200-day moving average.
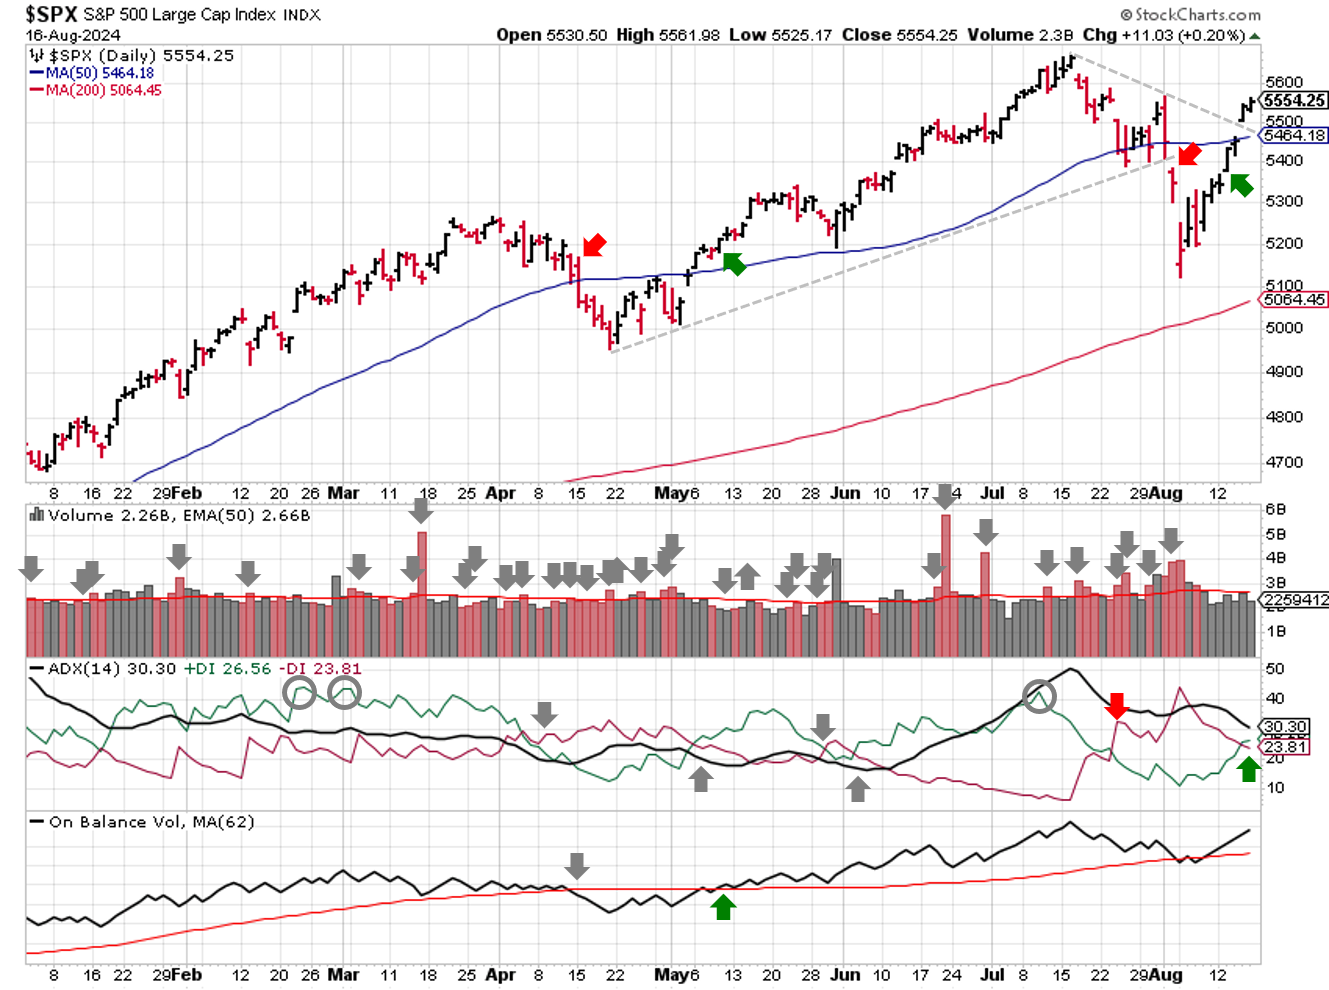
SPX Technical Analysis - August 18 2024
All three signals show bullish action. On Balance Volume was the first mover, going green on Monday. After putting in a potential rally start on August 6th, institutional activity confirmed the move on Tuesday with a follow-through day, which flipped the signal and the outlook to an uptrend. The ADX confirmed the bullish move on Friday.
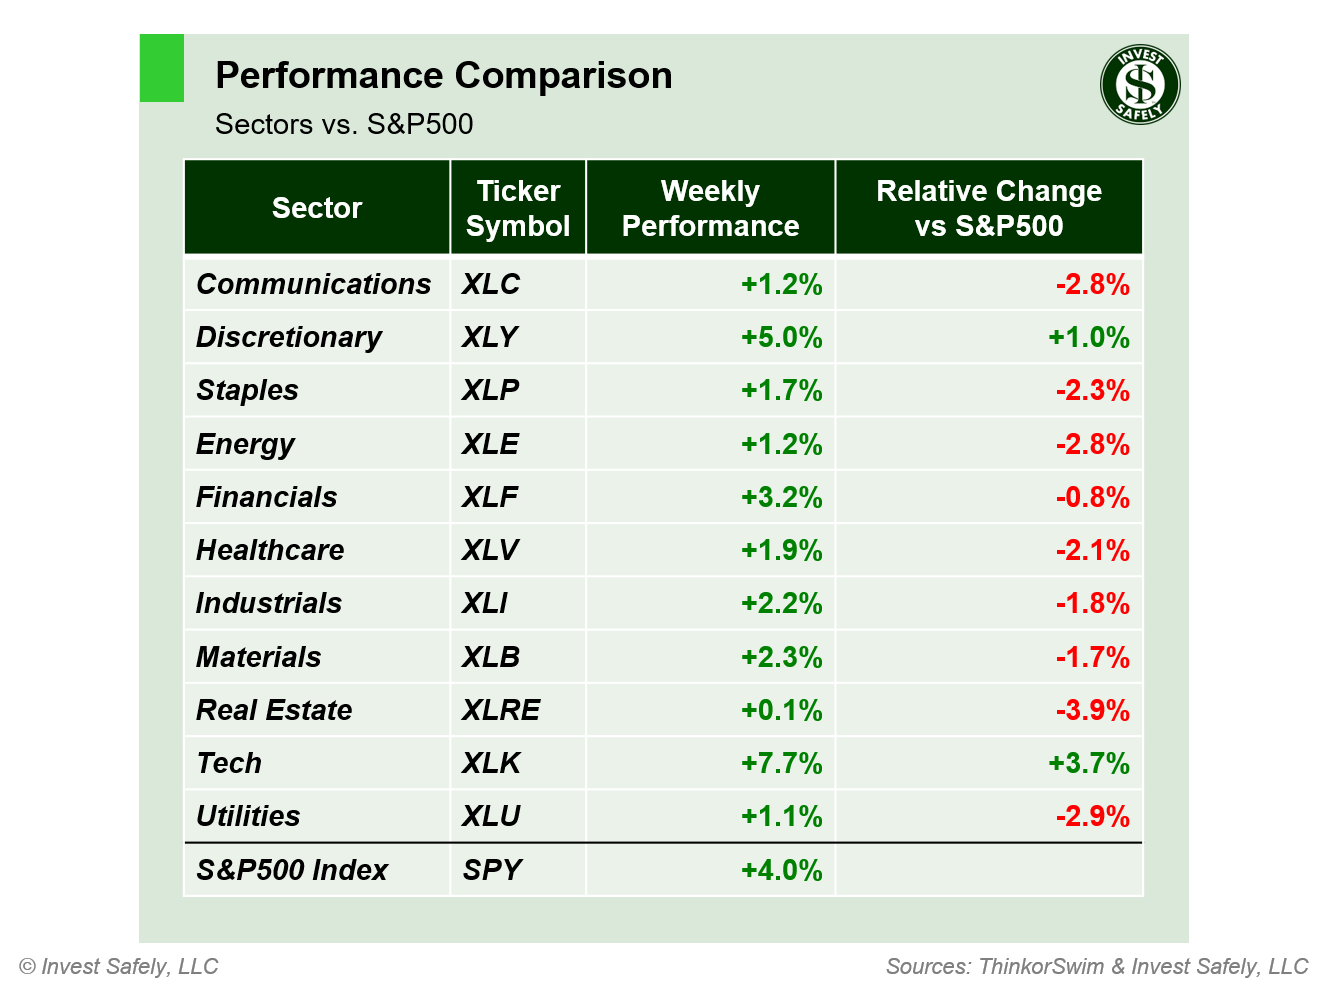
The Technology sector ($XLK) led the way last week, rising almost 8%! Real estate was the laggard ($XLRE), barely getting past break-even. The saying "a rising tide lifts all boats" applied last week, as the heavy hitters responsible for most of the movement in the overall index and outperformance was limited to just 2 sectors.
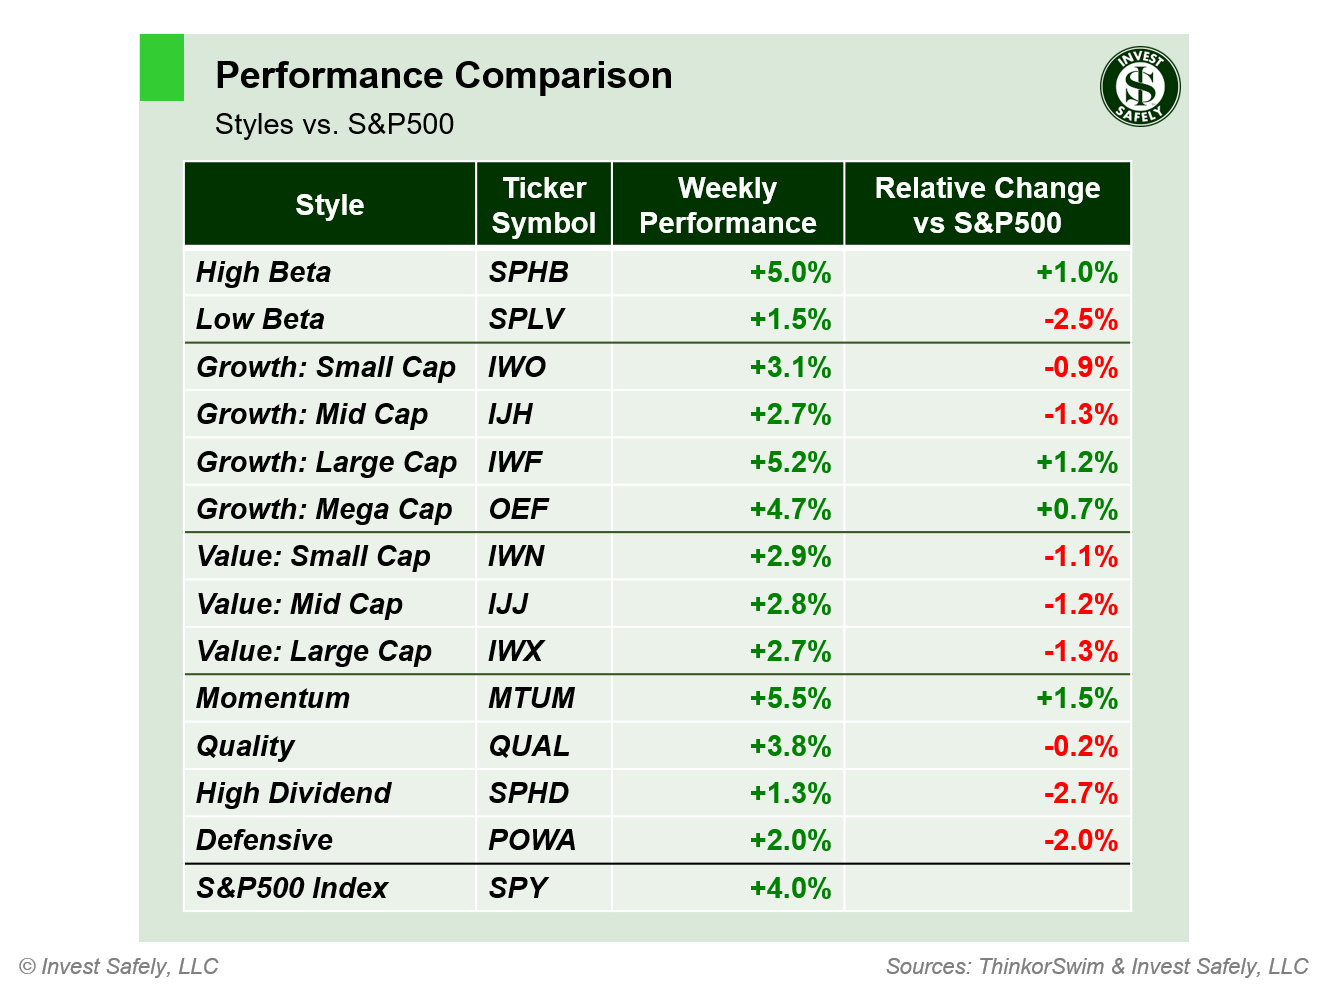
From a sector style perspective, Momentum, Large Cap, and High Beta tickers gained 5% or more, while high dividend and low beta tickers underperformed the general market.
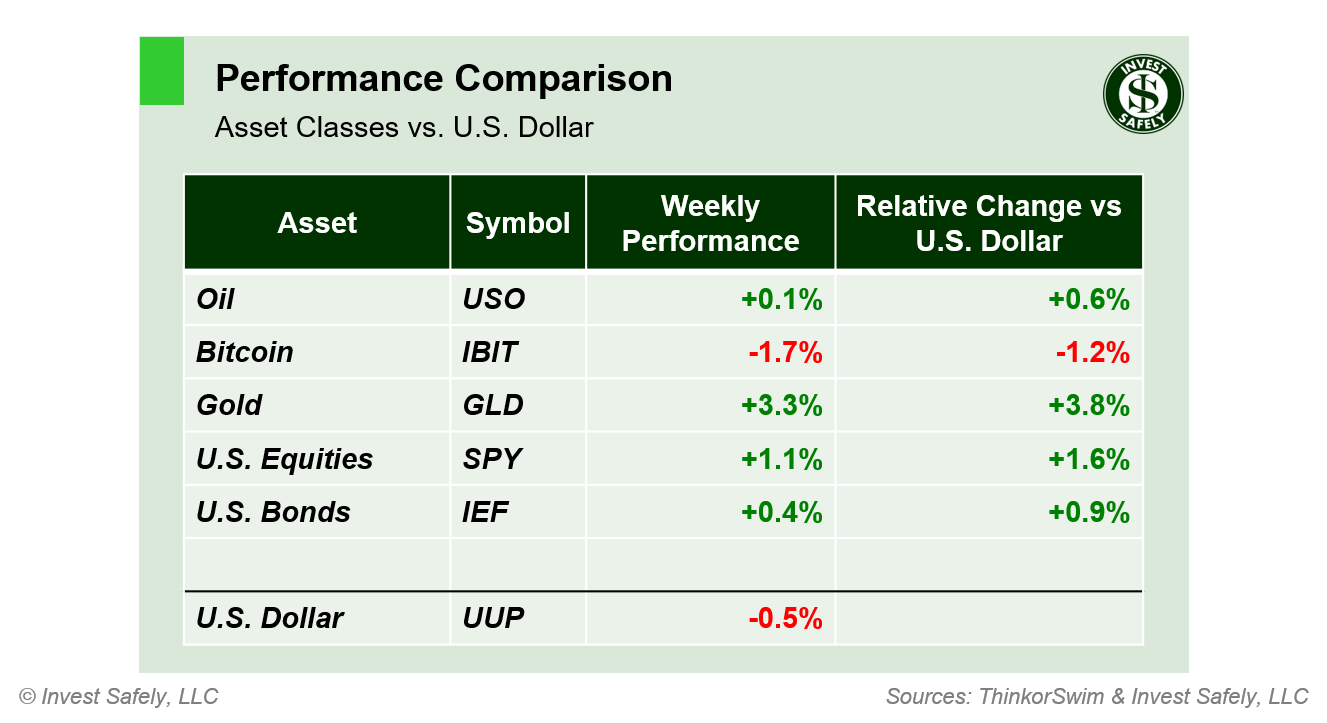
Gold led assets higher last week, benefiting from the weaker dollar, while Bitcoin led to the downside.
COMMENTARY
The volatility party ended as quickly as it started, with equities regaining most of their August sell-off and the $VIX back below 15. Just two weeks ago, the volatility index spiked to 65 and financial pundits were calling for emergency rate cuts. Seems like a year ago already; market time is a lot like dog-years in that sense.
July's retail sales data came in better than expected at +2.7% y/y, thanks in part to automotive sales. And as expected, July Producer and Consumer price indexes showed further slowing of inflation, reflecting the lower levels experienced last summer. The consumer price index (CPI) fell for the fourth month in a row, down to 2.9% y/y in July, from 3.0% y/y in June.
| CPI (y/y) | Actual | Prior | Expected |
| Headline | +2.9% | +3.0% | +3.0% |
| Core | +3.2% | +3.3% | +3.2% |
Producer prices (PPI) fell to 2.2% y/y in July, from June's 2.7% y/y reading
| PPI (y/y) | Actual | Prior | Expected |
| Headline | +2.2% | +2.7%* | +2.3% |
| Core | +2.4% | +3.0% | +2.7% |
August readings should benefit from the lower comparisons as well, but September through December will be more challenging.
This week is the Federal Reserve's annual Jackson Hole symposium, with remarks from Chairman Powell scheduled for Friday morning. Otherwise, a fairly quiet week for macroeconomic data.
With the market outlook back in uptrend territory, capital flows should support higher prices. It's not the time to get complacent though, as we were in almost the exact same position last August. Equity markets corrected to start the month, only to reverse higher heading into September. But that was the first of two head-fakes. Equities sold off again until early October, then rallied back to the 50-day moving average, only to head lower again...right up until the U.S. Treasury adjusted the bond allocations used for the Quarterly Refunding Announcement (QRA) and provided a rally catalyst.
Best to Your Week!
P.S. If you find this research helpful, please tell a friend.
If you don't, tell an enemy.
Sources: Bloomberg, CNBC, Federal Reserve Bank of St. Louis, Hedgeye, U.S. Bureau of Economic Analysis, U.S. Bureau of Labor Statistics
Share this Post on:

How to Make Money in Stocks: A Winning System in Good Times and Bad.
It's one of my favorites.
I regularly share articles and other news of interest on:
Twitter (@investsafely)
Facebook (@InvestSafely)
LinkedIn (@Invest-Safely)
Instagram (@investsafely)
Invest Safely, LLC is an independent investment research and online financial media company. Use of Invest Safely, LLC and any other products available through invest-safely.com is subject to our Terms of Service and Privacy Policy. Not a recommendation to buy or sell any security.
Charts provided courtesy of stockcharts.com.
For historical Elliott Wave commentary and analysis, go to ELLIOTT WAVE lives on by Tony Caldaro. Current counts can be found at: Pretzel Logic, and 12345ABCDEWXYZ
Once a year, I review the market outlook signals as if they were a mechanical trading system, while pointing out issues and making adjustments. The goal is to give you to give you an example of how to analyze and continuously improve your own systems.
- 2015 Performance - Stock Market Outlook
- 2016 Performance - Stock Market Outlook
- 2017 Performance - Stock Market Outlook
- 2018 Performance - Stock Market Outlook
- 2019 Performance - Stock Market Outlook
- 2020 Performance - Stock Market Outlook
IMPORTANT DISCLOSURE INFORMATION
This material is for general communication and is provided for informational and/or educational purposes only. None of the content should be viewed as a suggestion that you take or refrain from taking any action nor as a recommendation for any specific investment product, strategy, or other such purpose. Certain information contained herein has been obtained from third-party sources believed to be reliable, but we cannot guarantee its accuracy or completeness.
To the extent that a reader has any questions regarding the applicability of any specific issue discussed above to his/her individual situation, he/she is encouraged to consult with the professional advisors of his/her choosing. Invest Safely, LLC is not a law firm, certified public accounting firm, or registered investment advisor and no portion of its content should be construed as legal, accounting, or investment advice.
The material is not to be construed as an offer or a recommendation to buy or sell a security nor is it to be construed as investment advice. Additionally, the material accessible through this website does not constitute a representation that the investments described herein are suitable or appropriate for any person.
Hypothetical Presentations:
Any referenced performance is “as calculated” using the referenced funds and has not been independently verified. This presentation does not discuss, directly or indirectly, the amount of the profits or losses, realized or unrealized, by any reader or contributor, from any specific funds or securities.
The author and/or any reader may have experienced materially different performance based upon various factors during the corresponding time periods. To the extent that any portion of the content reflects hypothetical results that were achieved by means of the retroactive application of a back-tested model, such results have inherent limitations, including:
Model results do not reflect the results of actual trading using assets, but were achieved by means of the retroactive application of the referenced models, certain aspects of which may have been designed with the benefit of hindsight
Back-tested performance may not reflect the impact that any material market or economic factors might have had on the use of a trading model if the model had been used during the period to actually manage assets
Actual investment results during the corresponding time periods may have been materially different from those portrayed in the model
Past performance may not be indicative of future results. Therefore, no one should assume that future performance will be profitable, or equal to any corresponding historical index.
The S&P 500 Composite Total Return Index (the "S&P") is a market capitalization-weighted index of 500 widely held stocks often used as a proxy for the stock market. Standard & Poor's chooses the member companies for the S&P based on market size, liquidity, and industry group representation. Included are the common stocks of industrial, financial, utility, and transportation companies. The S&P is not an index into which an investor can directly invest. The historical S&P performance results (and those of all other indices) are provided exclusively for comparison purposes only, so as to provide general comparative information to assist an individual in determining whether the performance of a specific portfolio or model meets, or continues to meet investment objective(s). The model and indices performance results do not reflect the impact of taxes.
Investing involves risk (even the “safe” kind)! Past performance does not guarantee or indicate future results. Different types of investments involve varying degrees of underlying risk. Therefore, do not assume that future performance of any specific investment or investment strategy be suitable for your portfolio or individual situation, will be profitable, equal any historical performance level(s), or prove successful (including the investments and/or investment strategies describe on this site).
Investing Process Links
Stabilize- Organize your $$$
- Manage your $$$
Plan
- Why You Invest
- Ways to Invest
- Where to Invest
- What to Invest In
Execute
- When to Invest
- How Much to Invest
- Buying & Selling
Monitor
- Track The Market
- Track Your Returns
Reflect & Adjust
- Improve Your Returns
- Adjust your Holdings
Popular Pages
- Jim Cramer- Personal Incomes Statements
- Hyperinflation
- Calculating Beta
- SMART Financial Goals
Blogroll
- Advisor Perspectives- Dividend Growth Investor
- Elliott Wave Lives On
- On My Radar | CMG Wealth
- Sure Dividend
- The Big Picture
- The Fat Pitch
- Thoughts from the Frontline
- Trader Feed
Sponsored Links
Invest Safely provides valuable, time-saving info about personal finance, money management, and investing.


