Weekend Stock Market Outlook
Stock Market Outlook For The Week of
September 10th = Uptrend
INDICATORS
20/50 Day Moving Averages: Uptrend
Price & Volume Action: Uptrend
Objective Elliott Wave Analysis: Mixed
No change from last week's signal set, but the price action doesn't leave us with that warm, fuzzy feeling. We did see trading volume return, but so did sellers. Traders brushed off North Korean concerns and one hurricane. Will Hurricane Irma (and potentially Jose) stop this bull market?
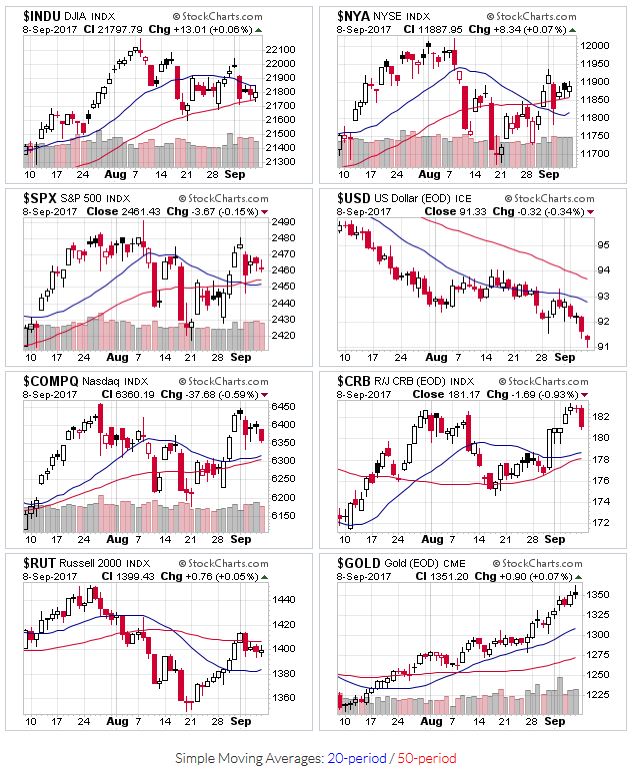
The Nasdaq and S&P500 begin the week above their 20 and 50 day moving averages. The Dow starts this week above the 50 day, but below the 20 day. And finally, the Russell 2000 is below the 50 day, but above the 20 day. With a majority of the indexes above their 50 day, we'll keep the uptrend signal in place for this week.
2017-09-10-US Stock Market Averages
Most of the indexes added a distribution day to their already elevated count. Given this environment, it shouldn't be surprising that most leading stocks that have broken out haven't made much progress. Even more concerning is the lack of trading volume during those breakouts. Ideally, you'd like to see volumes at least 50% higher than average. That said, these stocks aren't breaking down either.
Given the lack of progress by leading stocks, it probably also isn't surprising that OEW continues to show the market at an inflection point. We continue to wait for a break of key support levels to know which way this market is headed.
If you find this research helpful, please tell a friend. I share articles and other news of interest via Twitter; you can follow me @investsafely. The weekly market outlook is also posted on Facebook and Linkedin.
You can check out how well (or poorly) the outlook has tracked the market using past performance estimates:
For the detailed Elliott Wave Analysis, go to the ELLIOTT WAVE lives on by Tony Caldaro. Charts provided courtesy of stockcharts.com.


