Weekend Stock Market Outlook
Stock Market Outlook For The Week of
September 11th = Mixed
INDICATORS
20/50/200 Day Moving Averages: Mixed
Price & Volume Action: Mixed
Objective Elliott Wave Analysis: Mixed
US stock indexes ran into a different type of Friday surprise last week; major selling across the board. No sector was safe, and many leading stocks were hammered.
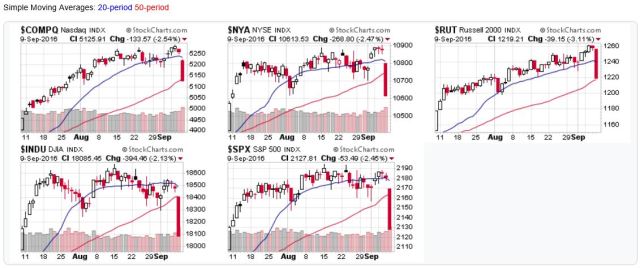
All of the major stock market averages blew through their 20-day moving averages, and 4 of the 5 closed below their 50-day averages as well. The Russell 2000 is just barely above that level. All remain above their 200 day averages. So a long-term uptrend remains intact, but also means prices will have to fall substantially before we get a long-term downtrend signal from the moving averages.
2016-09-11-US Stock Market Averages
No surprise that Friday added another distribution day to the count. The question for us (as individual investors)? Are institutions rebalancing their portfolios to lock-in profits since the Brexit vote, or are they taking money off the table and out of stocks? Fortunately, the solution in either case is the same. Limit your losses, and only buy when institutions are buying (i.e. don't fight the market).Friday also provided the second half of OEW's 5% correction. With many support levels now in play, there is no shortage of opportunities for the market to find its footing (Weekend Update).
One sell-off isn't enough to completely reverse the market outlook, and we're still within a stone's throw of all time highs. But add in weak price action over the past few weeks, and we're definitely receiving mixed signals from the market, which supports a cautious approach.
If you haven't already, check your holdings, tightening your stop orders to recent support levels, and take some profits if you've hit your targets. As mentioned last week:
- Growth strategy: Book your profits if they're over 20%. Between 0% and 20%, check key support levels; if your profits would be wiped out before stock prices reached support, consider selling at least half your position.
- Income strategy: check your position size and consider selling shares to if any one position has become too dominate (>5% of your total portfolio). Also, make sure the fundamentals are still strong (payout ratio, earnings per share, price/earnings ratio, etc.).
For the detailed Elliott Wave Analysis, go to the ELLIOTT WAVE lives on by Tony Caldaro. Charts provided courtesy of StockCharts.com.


