Stock Market Outlook - Feb 14, 2016
Stock Market Outlook entering the Week of February 14th = Downtrend
MOVING AVERAGES
Short-term (20 DMA): Downtrend
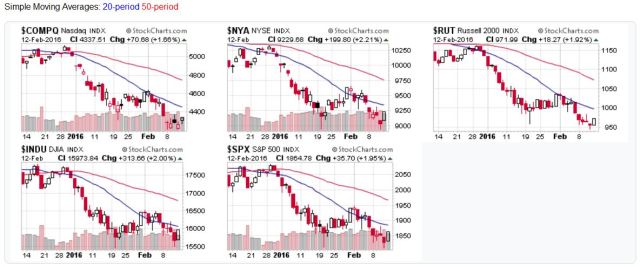
All major stock market averages fell or remained below their 20-day moving averages.
Intermediate (50 DMA): Downtrend
All the major stock market averages remained below their 50-day moving averages.
Long-term (200 DMA): Downtrend
All the major stock market averages remained below their 200-day moving averages.
2016-02-14 - US Stock Market Averages | Chart courtesy of StockCharts.com
COMMENTARYLots of volatility last week (in the form of gaps up and down in prices for the market open), as the new bear market begins to assert itself.
Price and volume action destroyed any rally taking shape at the beginning of last week. But all is not lost. OEW estimates that the late Thursday/Friday price movement may be the start of a rally. While we need to wait for a confirmation (for both OEW and price/volume), you may want to think about taking short-term profits if you were hedging or shorting stocks.
Only a handful of stocks remain in my portfolio; they're the only ones still in uptrends, despite market conditions. Needless to say, I'm keeping a close eye on them for any weakness.
Next week is a short trading week; Monday is President's Day in the US, so markets will be closed.
For the detailed Elliott Wave Analysis, go to the ELLIOTT WAVE lives on by Tony Caldaro.Charts courtesy of StockCharts.com.
Moving Average Signals:
Uptrend = Market indexes remained above their moving average during the trading week
Downtrend = Market indexes remained below their moving average during the trading week
Buy signal = Market indexes rose above their moving averages during the trading week
Sell signal = Market indexes fell below their moving averages during the trading week


